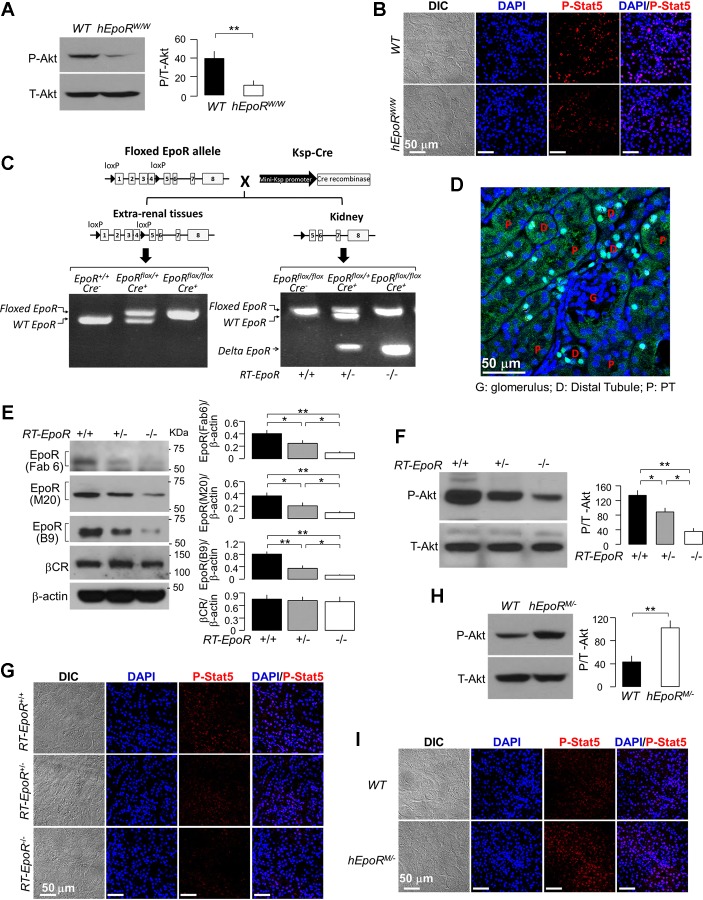
Fig. 2.
Measurement of EpoR signaling activity in three genetically modified mouse lines. A and B: EpoR signaling activity in the kidney of WT mice and hEpoRW/W mice at baseline. A: representative immunoblots for phospho-Akt (P-Akt, left), and summary of all immunoblots (right). Data are expressed as means ± SD (n = 6) from each group, statistical significance was assessed by unpaired Student’s t-test, and significance was accepted when *P < 0.05, **P < 0.01, between 2 groups. B: representative immunofluorescent images from 3 independent experiments for phospho-Stat5 in renal cortex of WT mice and hEpoRW/W mice. Scale bar = 50 μm. C: generation and genotyping of specific knockout of EpoR in renal tubules. Mice with renal tubule-specific deletion of EpoR in (homozygous: Ksp-Cre+;EpoRflox/flox = RT-EpoR−/−; heterozygous: Ksp-Cre+;EpoRflox/+ = RT-Epo+/− and Ksp-Cre−;WT- EpoRflox/flox = RT-EpoR+/+) were generated after mating Ksp-Cre+;EpoRflox/+ with Ksp-Cre+;EpoRflox/+ mice. Left: PCR of extra-renal tissue (tail) displaying floxed EpoR and WT EpoR bands. Right: PCR results in the kidney and truncated EpoR transcript. Floxed EpoR and WT EpoR bands and truncated EpoR band were present in DNA samples extracted from kidney. D: representative fluorescent immunohistochemical image from 3 independent experiments. Paraffin-embedded kidney sections were stained with anti-Cre (green) and the nuclei with Cyto-61 (blue). E: EpoR expression in the kidney of mice. Representative immunoblot from 4 independent experiments for EpoR with several antibodies and for βcR in the kidney (left) and a summary of all immunoblots (right). F: representative immunoblots from 4 independent experiments for phospho-Akt (P-Akt, left) and a summary of all immunoblots (right). Data are expressed as means ± SD (n = 4) from each group, statistical significance was evaluated by one-way ANOVA followed by Student-Newman-Keuls post hoc test, and significance was accepted when *P < 0.05, **P < 0.01, between 2 groups for E and F. G: representative immunofluorescent images for phospho-Stat5 in the kidney. H and I: EpoR signaling activity in the kidney of WT mice and hEpoRM/− mice at baseline. H: representative immunoblots from 4 independent experiments for phospho-Akt (P-Akt, left) and a summary of all immunoblots (right). Data are expressed as means ± SD (n = 4) from each group, statistical significance was assessed by unpaired Student’s t-test, and significance was accepted when *P < 0.05, **P < 0.01, between 2 groups. I: representative immunofluorescent images from 3 independent experiments for phospho-Stat5 in the kidney of mice. Bar scale = 50 μm.

