
Fig. 4.
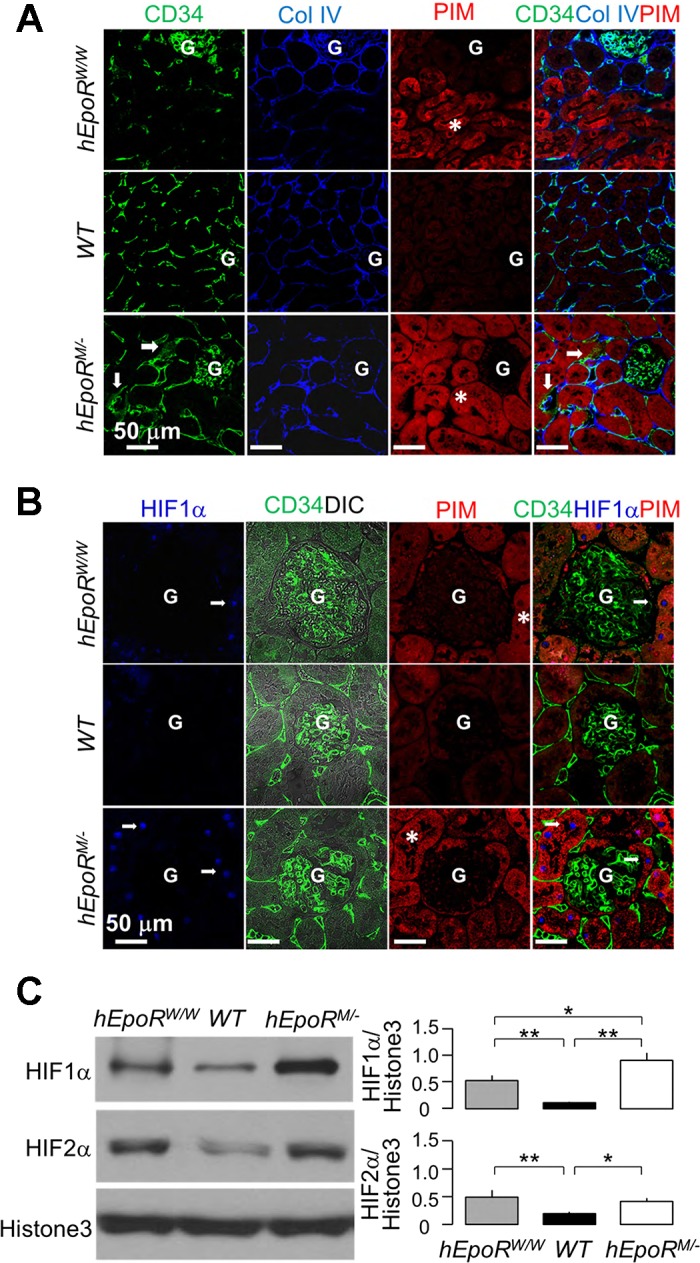
Abnormal EpoR signaling in the kidney leads to hypoxia in the kidney. hEpoRW/W mice, WT mice, hEpoRM/− mice, and hEpoRM/M mice at baseline were intraperitoneally injected with pimonidazole HCl (PIM). Two hours after injection, the kidneys were harvested for immunohistochemistry. Hypoxia was visualized with anti-PIM to detect PIM adducts in the renal tubules. A: representative immunofluorescent images from 3 independent experiments for CD34, Col IV, and PIM in the kidneys. CD34 (green), collagen IV (Col IV, blue), and PIM (red) were costained. Arrows indicate disorganized peritubular capillary with thicker basement membrane. Hypoxic areas are highlighted by massive PIM adducts (asterisks). G: glomerulus. Bar scale = 50 μm. B: representative immunofluorescent images from 3 independent experiments for hypoxia-inducible factor-1α (HIF1α), CD34, and PIM in the kidneys. CD34 (green), HIF1α (blue), and PIM (red) were costained. Arrows indicate nuclear stain pattern of HIF1α. The hypoxic areas are demonstrated by massive PIM adducts (asterisks). G: glomerulus. Bar scale = 50 μm. C: representative immunoblots from 4 independent experiments for HIF1α, HIF2α and histone 3 protein (loading control) in nuclear extracts from the kidney of hEpoRW/W mice, WT mice, hEpoRM/− mice, and hEpoRM/M mice at baseline (top) and a summary of all immunoblots (bottom). Data are expressed as means ± SD (n = 4) from each group, statistical significance was evaluated by one-way ANOVA followed by Student-Newman-Keuls post hoc test, and significance was accepted when *P < 0.05, **P < 0.01, between 2 groups.