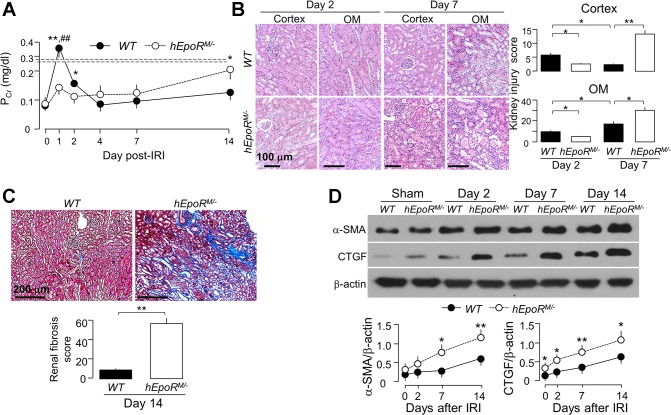
Fig. 8.
Hyperactive EpoR signaling reduced acute kidney damage but promoted tubulointerstitial changes in hEpoRM/− after IRI. At predetermined time points, mice from each genotype were killed, blood was collected, and kidneys were harvested. A: plasma creatinine (PCr). Data are expressed as means ± SD (n = 6) from each group, statistical significance was evaluated by unpaired Student’s t-test, and significance was accepted when *P < 0.05, **P < 0.01, between 2 groups for same time point. B: acute kidney damage in WT mice and hEpoRW/W mice; representative micrographs from 4 independent experiments of H&E stain (top) of kidney cortex and OM and kidney injury scores (bottom) obtained in a blinded fashion at days 2 and 7 after IRI. Scale bar = 100 μm. C: renal fibrosis in WT mice and hEpoRW/W mice; representative microscopic images from 4 independent experiments of trichrome stain (left) in the kidney section and renal fibrosis scores (right) obtained in a blinded fashion at day 14 after IRI. Scale bar = 200 μm. Data are expressed as means ± SD from each group and statistical significance was evaluated by one-way ANOVA followed by Student-Newman-Keuls post hoc test and significance was accepted when *P < 0.05, **P < 0.01, between 2 groups for B and C. D: representative immunoblots from 4 independent experiments for α-SMA and CTGF in the kidney (left) of WT mice and hEpoRM/− mice at predetermined time points after IRI and a summary of all immunoblots (right). Data are expressed as means ± SD from each group, statistical significance was evaluated by unpaired Student’s t-test, and significance was accepted when *P < 0.05, **P < 0.01, between 2 groups for same time point for A and D.

