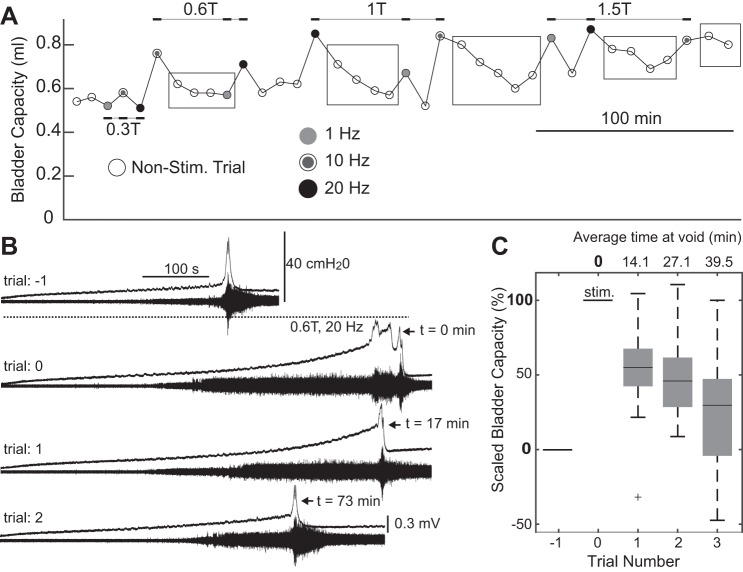
Fig. 4.
Stimulation of the sensory pudendal nerve often led to increases in bladder capacity on subsequent nonstimulated trials (stimulation carryover effect). A: bladder capacities for each trial in an experiment. Circles indicate the start of each trial. Black rectangles were added to highlight trials that show a stimulus carryover effect. B: sequential trials collected during a single experiment. Stimulation at 0.6 T, 20 Hz (trial 0) increased bladder capacity and initially disrupted coordinated voiding. On the subsequent trial (trial 1) the bladder capacity remained increased. On the subsequent and final trial of the series and the experiment (trial 2) the bladder capacity decreased, but remained elevated compared with the control trial (trial −1) conducted before stimulation. C: distributions of scaled bladder capacity on the three trials following stimulation at 1 or 1.5 T and 10 or 20 Hz. Bladder capacities were scaled such that 0% is the bladder capacity of the trial preceding stimulation, and 100% is the bladder capacity of the stimulation trial. Only groups of trials in which stimulation increased bladder capacity by at least 20% relative to the preceding trial and in which at least three nonstimulation trials followed were included in this analysis (n = 15, 48% of trials). Box plots were created using MATLAB’s boxplot() command, and the center bars represent the median value, box edges are the 25th and 75th percentiles, and the whiskers extend to the most extreme data points, which are not considered to be outliers. Outliers are indicated by the plus sign (+).

