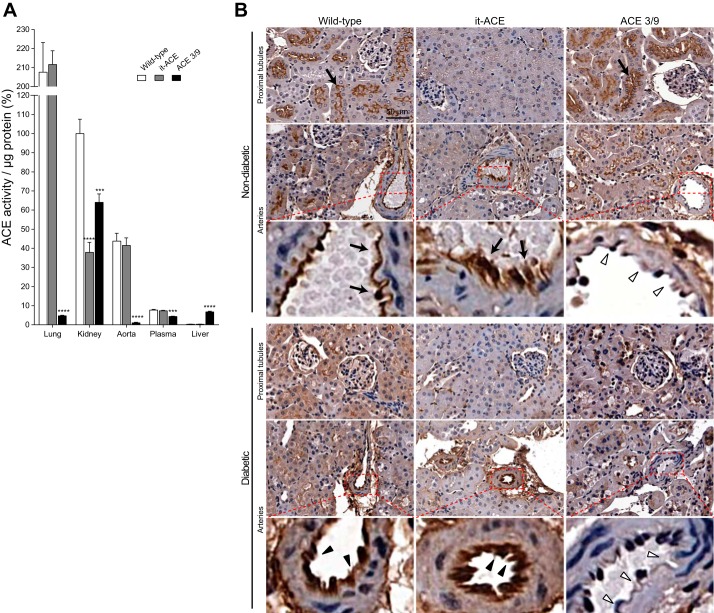
Fig. 1.
A: the angiotensin-converting enzyme (ACE) activity of individual organs was corrected by protein concentration and expressed as percentage of wild-type (WT) kidney ACE activity. Values represent means ± SE; n = 8–11; ***P < 0.001 and ****P < 0.0001 vs. WT mice. B: representative images of ACE immunostaining at baseline (top) and after 6 mo of diabetes induction (bottom). Black arrows indicate ACE expressions in the proximal tubules and arteries at baseline. Black arrowheads indicate ACE expressions in arteries 6 mo after induction of diabetes. White arrowheads indicate no ACE expression in arteries from diabetic and nondiabetic ACE 3/9 mice. Diabetic WT and ACE 3/9 mice revealed decreased ACE expression in proximal tubules. No tubular ACE expression was observed in diabetic and nondiabetic it-ACE mice. Original magnification: ×20.

