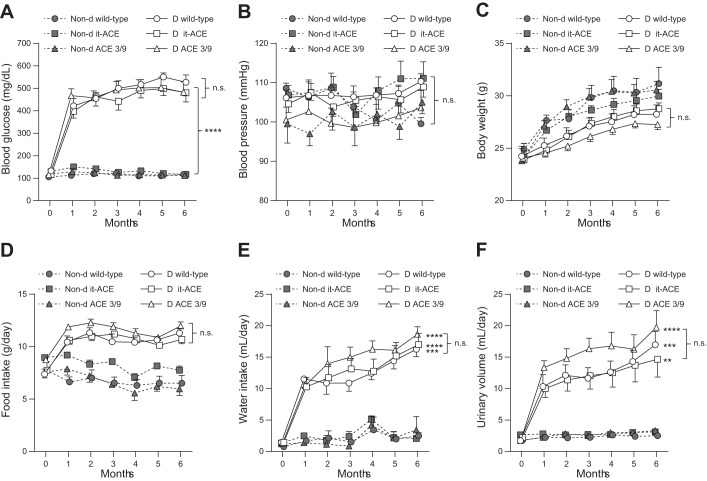
Fig. 2.
Monthly measurements of blood glucose (A), systolic blood pressure (B), body weight (C), food intake (D), water intake (E), and urinary volume (F) during 6 mo of diabetes. Values represent means ± SE; n = 10–12; **P < 0.01, ***P < 0.001, and ****P < 0.0001 vs. the respective nondiabetic control. D, diabetic; Non-d, nondiabetic.

