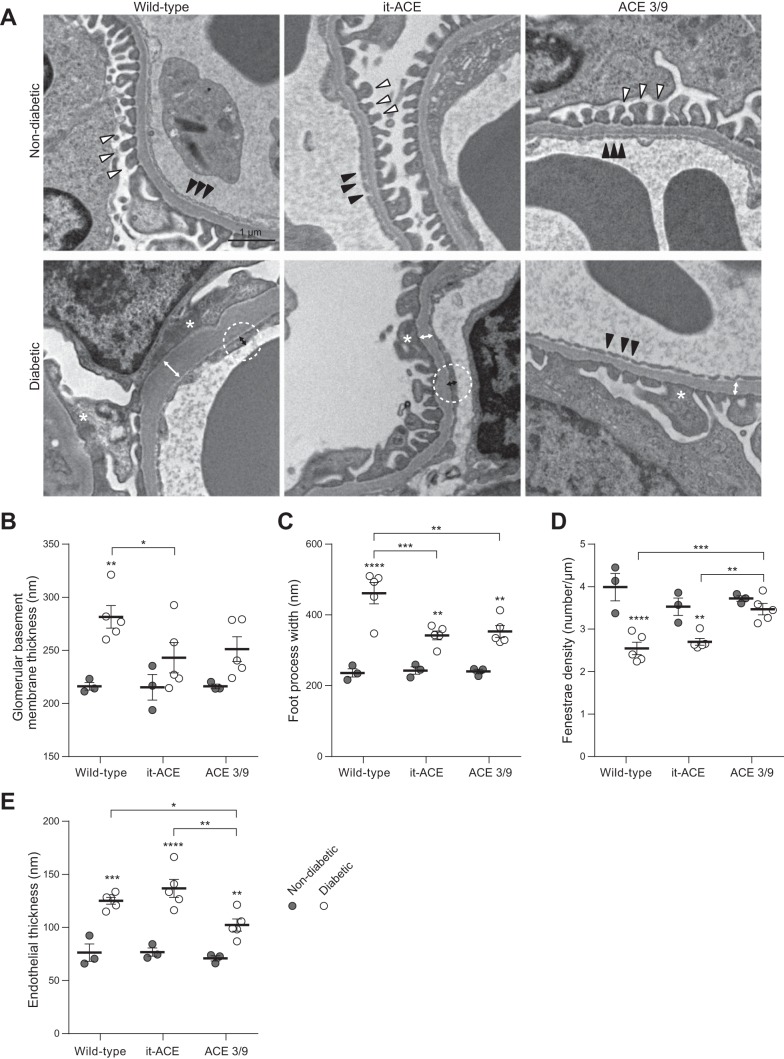
Fig. 6.
A: representative electron micrographs of glomeruli. White and black arrowheads indicate normal foot processes and fenestrae structures, respectively. Asterisks indicate foot process effacement. White and black bidirectional arrows indicate glomerular basement membrane (GBM) thickness and endothelial thickness in diabetic groups, respectively. Original magnification: ×10,000. Quantification of GBM thickness (B) and foot process (C) width, fenestrae density (D; number of fenestrae per μm of GBM), and endothelial thickness (E) was determined from 3 different fields per glomerulus. Each dot represents the average of the value obtained for each mouse. Three glomeruli were assessed per mouse. Horizontal bars represent the means ± SE; n = 3–5; *P < 0.05, **P < 0.01, ***P < 0.001, and ****P < 0.0001 vs. the respective nondiabetic control.

