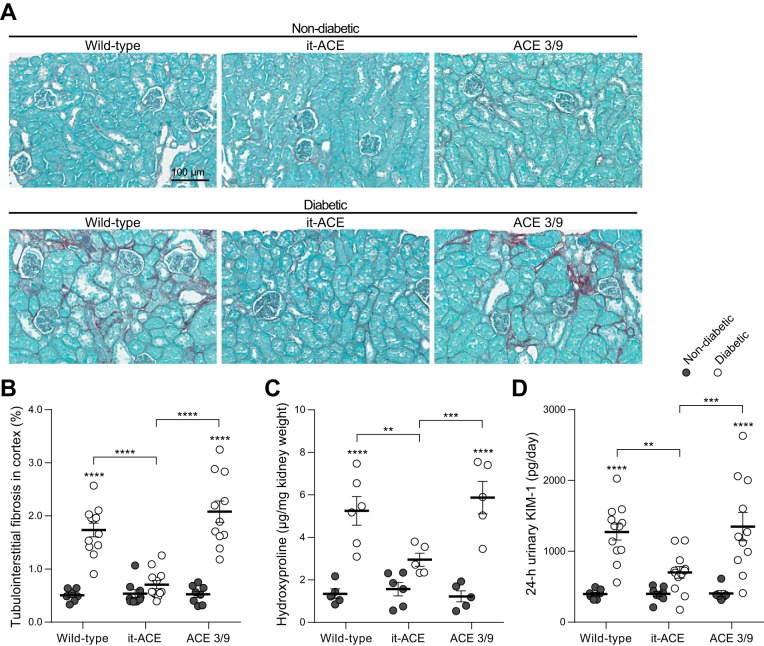
Fig. 7.
A: representative images of Sirius red staining. Original magnification: ×20. B: quantification of tubulointerstital fibrosis in cortex was evaluated using Sirius red staining. After whole slide scanning, total cortical area and fibrotic area in cortex were calculated using ImageJ software. Hydroxyproline levels in kidney homogenate (C) and 24-h urinary kidney injury molecule-1 (KIM-1) excretion (D) after 6 mo of diabetes. Data are represented as individual values for each mouse (dots). Horizontal bars represent the means ± SE; **P < 0.01, ***P < 0.001 and ****P < 0.0001 vs. the respective nondiabetic control.

