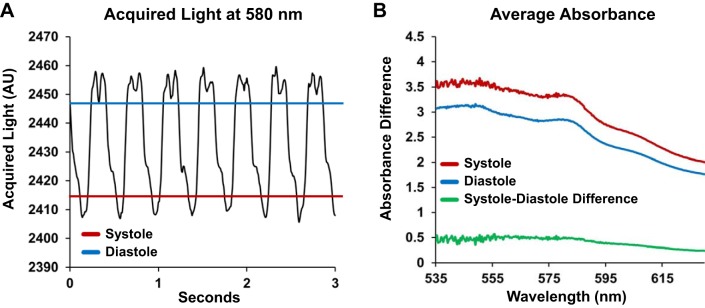
Fig. 4.
Transmural absorbance changes between acquisitions during systole and diastole are dominated by changes in pathlength. A: transmural light acquired from the epicardial surface was greatest during diastole (blue line) and was lowest during systole (red line). B: when transmural absorbance spectra acquired during systole were compared with spectra acquired during diastole, there was no spectral structure in the shape of the difference between the spectra (green line). n = 11.

