Fig. 2.
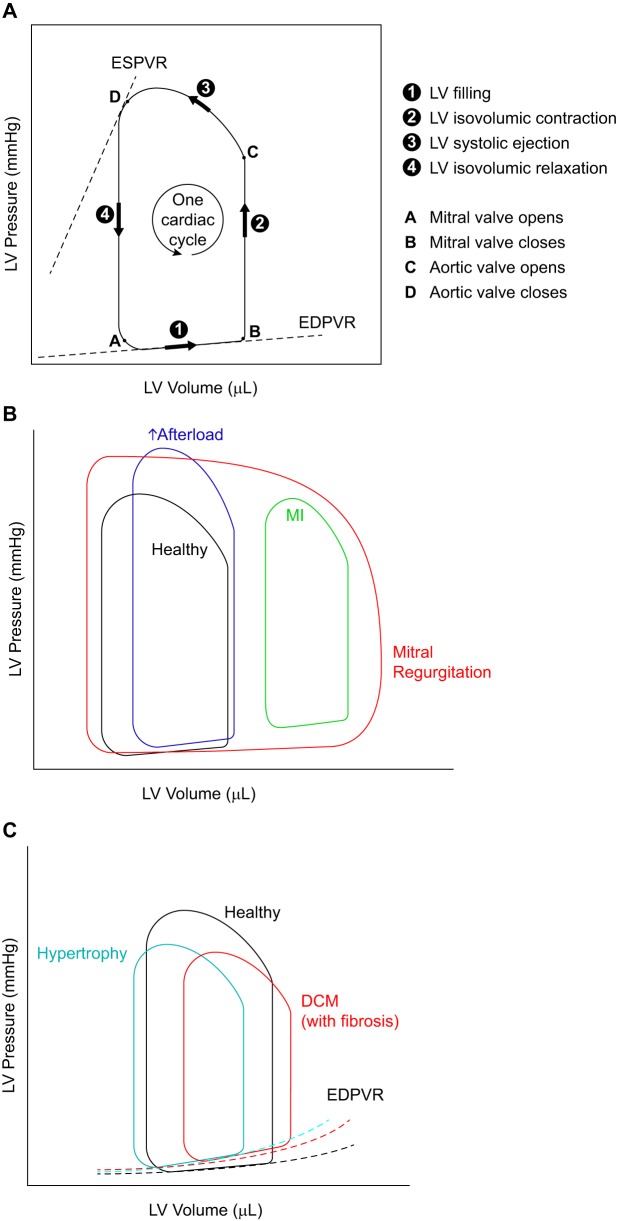
Illustrations of pressure-volume (P-V) loops and how they are altered in heart disease. A: P-V loops representing the changes in pressure and volume of the left ventricle (LV) during one cardiac cycle. Information in LV pressure and volume during different phases of a cardiac cycle can be obtained from this loop as indicated. B: the shape and relative location of the P-V loop are affected differently in various types of heart diseases. In mitral regurgitation, the width of the P-V loop does not represent the stroke volume, because not all of the blood is pumped out of the LV, due to the regurgitant mitral valve. The mitral regurgitation is also responsible for the absence of a true isovolumic relaxation or contraction. C: end-diastolic P-V relationship (EDPVR) can serve as a measure of myocardial stiffness (of the LV). A steeper slope for this curve correlates with increased stiffness (reduced compliance) of the LV myocardium. ESPVR, end-systolic pressure-volume relationship; DCM, dilated cardiomyopathy.

