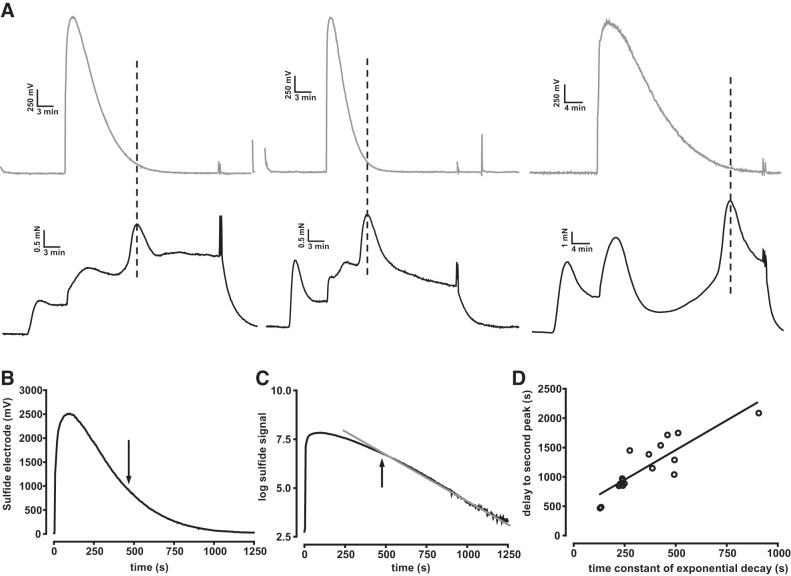
Fig. 8.
Temporal relationship between bath sulfide concentration and phase 2 (Ph2) contraction. A: simultaneous recording of the sulfide sensor signal (gray traces) and tension development (black traces) from 3 experiments following the injection of 1,000 μM Na2S into the bath. Dashed lines indicate the time at which the Ph2 contractions reached their peaks. B and C: representative sulfide sensor signal plotted using linear (B) and logarithmic (C) ordinates, highlighting the monoexponential decay of the sensor signal after it had fallen by ~60%. D: correlation between the time constant of the monoexponential component of decay of the sensor signal and the delay between the injection of sulfide and the peak of the Ph2 contraction.

