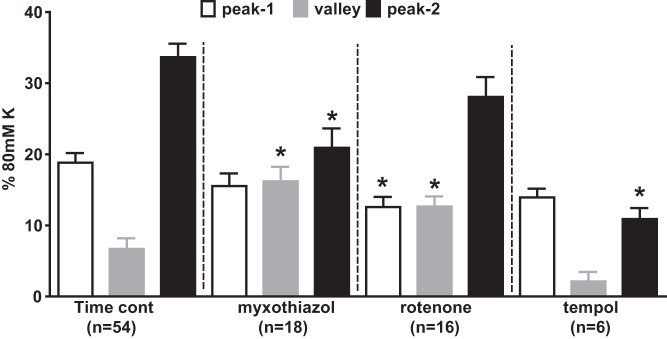
Fig. 9.
Effects of mitochondrial blockers and TEMPOL on the contractile response to 1,000 μM Na2S. A: amplitudes of the peak of the Ph1 contraction (white bars), the nadir of the subsequent relaxation (gray bars), and peak of the Ph2 contraction evoked by 1,000 μM Na2S in pulmonary arteries preconstricted with 5 μM PGF2α under control conditions (left) and in the presence of myxothiazol (1 μM), rotenone (1 μM), or TEMPOL (3 mM). Numbers of replicates under each condition are shown. *P < 0.05, significantly different from the corresponding control value for that phase.

