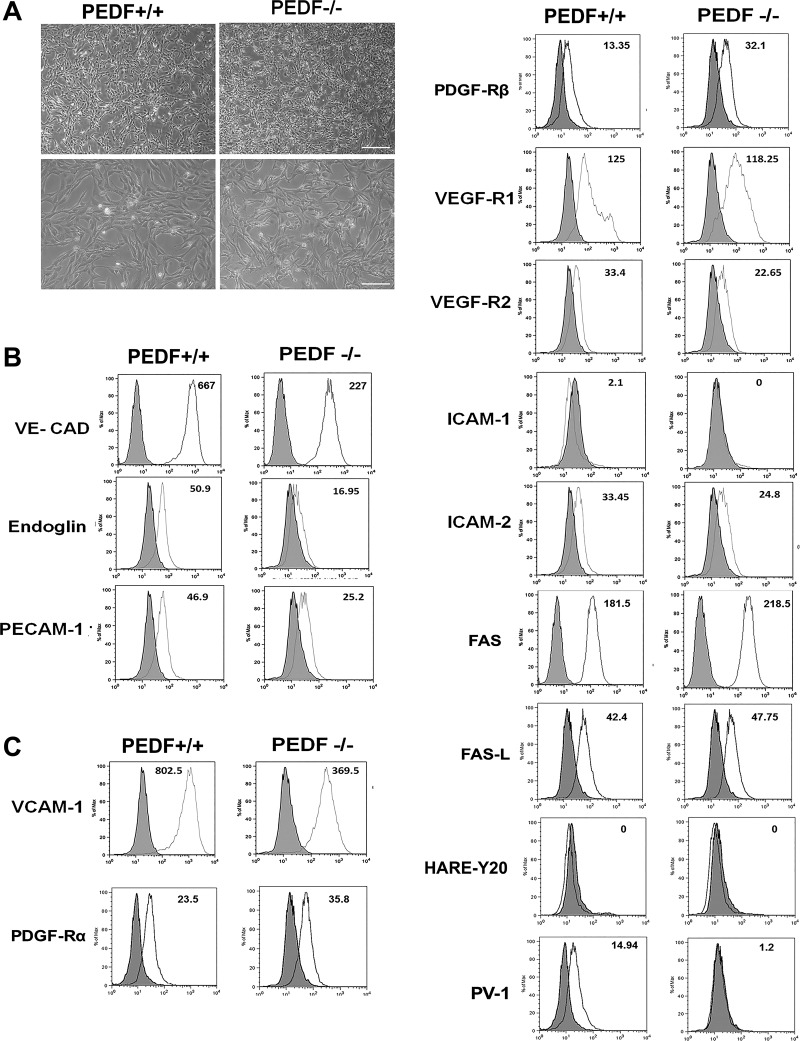
Fig. 1.
Isolation and characterization of mouse ChECs. PEDF+/+ and PEDF−/− ChECs were prepared as described in materials and methods and propagated in 60-mm tissue culture dishes coated with 1% gelatin. A: phase micrographs of ChECs. Images were captured in digital format at scale bar = 100 µm and magnifications at scale bar = 20 µm. B: expression of specific ChEC markers. ChECs were examined for expression of VE-cadherin, endoglin, and PECAM-1 by FACS analysis. C: expression of other RPE cell markers. ChECs were examined for expression of VCAM-1, PDGF-Rα, PDGF-Rβ, VEGF-R1, VEGF-R2, ICAM-1, ICAM-2, FAS, FAS-L, PV-1, and HARE-Y20 by FACS analysis. The shaded area shows control IgG staining. These experiments were repeated using two different isolations of ChECs with similar results (n ≥ 3). The representative mean fluorescence intensities are indicated in each graph.

