Figure 3.
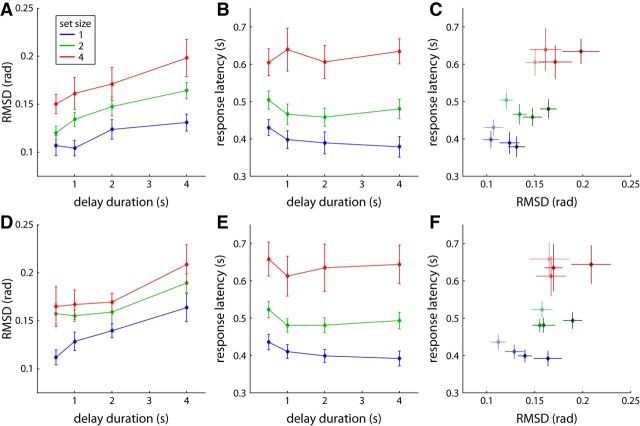
Behavioral results for Experiment 1 (memory condition) and Experiment 2. Response measures are shown for trials classified as responses to target only. A, RMSD of saccadic response direction from target direction for Experiment 1. B, Median saccadic response latency for Experiment 1. C, Median response latency plotted against RMSD for each set size and delay condition. Data points for different delay durations are plotted in different shades, with brighter colors indicating shorter delays. D–F, Corresponding results for Experiment 2. Error bars indicate ±1 SE in all panels.

