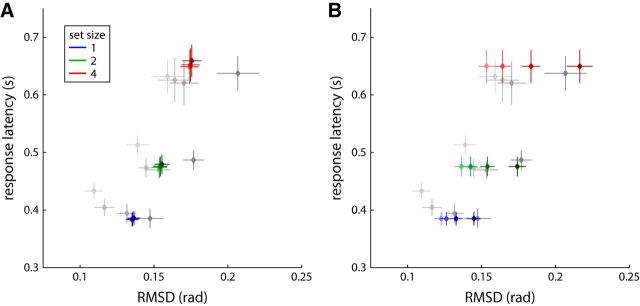
Figure 4.
Model fits and experimental results, pooled over Experiments 1 and 2. All results are plotted as median response latency against RMSD for each set size and delay duration (as in Fig. 3C,F). Behavioral results are plotted as gray diamonds, model results as colored diamonds, with lighter shading of data points indicating shorter delay duration. A, Model with exponential decay of activity over delay period. B, Model with set-size-dependent drift over delay. Error bars indicate ±1 SE in all panels.

