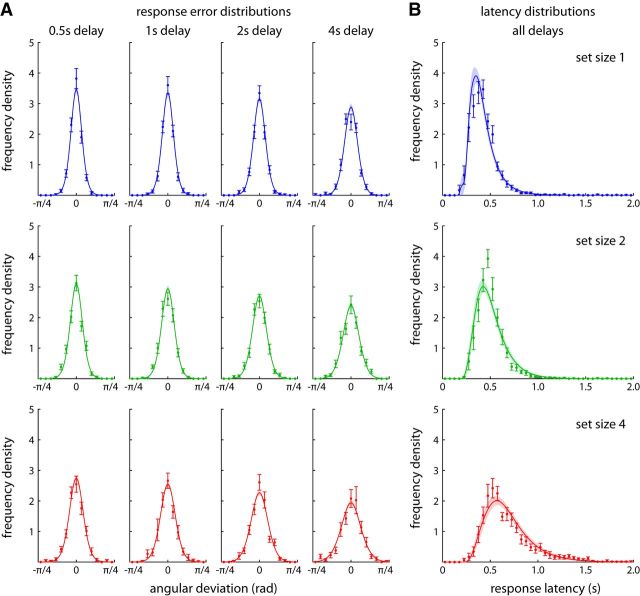
Figure 5.
Distributions of response errors and latencies for experimental data and model fits. A, Distributions of deviations of the response direction from the target direction, shown separately for each set size and delay duration. B, Distributions of response latencies, plotted separately for each set size, pooled over delay durations. Experimental data are shown as points with error bars indicating ±1 SE; mean fits of the set-size-dependent drift model are shown as solid lines with shaded region indicating ±1 SE.

