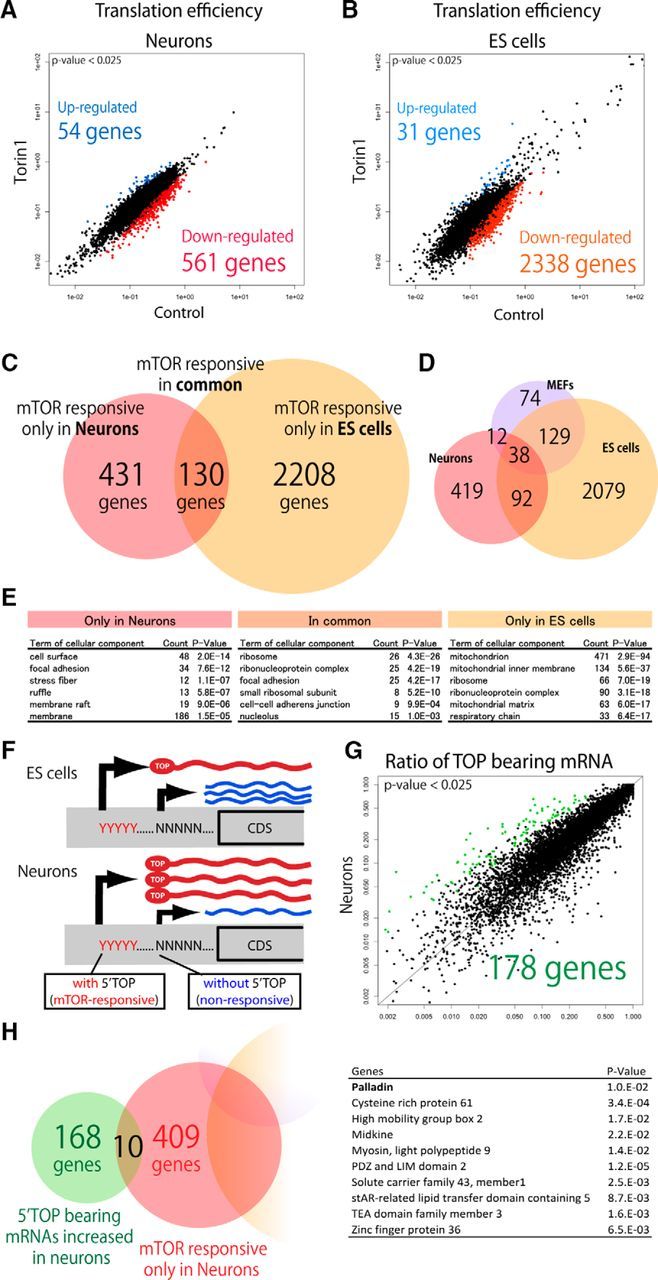
Figure 3.

Differences in translation efficiency of ORFs between ES cells and neurons. A, B, Scatter plots of translation efficiency of highly expressed genes in neurons (A) and ES cells (B). Significantly downregulated or upregulated genes are highlighted in colors. C, Venn diagram illustrating overlap of genes whose translational efficiency was significantly downregulated by Torin 1-treatment in neurons and ES cells. D, Venn diagram illustrating overlap of genes whose translational efficiency was significantly downregulated by Torin 1-treatment in this report (neurons and ES cells) and a previous study (MEFs; Thoreen et al., 2012). E, Categories of gene ontology significantly enriched in the genes that are affected by Torin 1 specifically in neurons, in both neurons and ES cells, and specifically in ES cells. F, Schematic of alternative transcription start sites producing mRNAs with and without 5′TOP sequences at a different ratio in different cell types. G, A scatter plot of ratio of mRNAs containing 5′TOP in neurons and ES cells. H, Venn diagram of genes that are mTOR-regulated selectively in neurons and genes that generate mRNAs containing 5′TOP to a greater extent in neurons than ES cells. The overlapping 10 genes are listed with p values.
