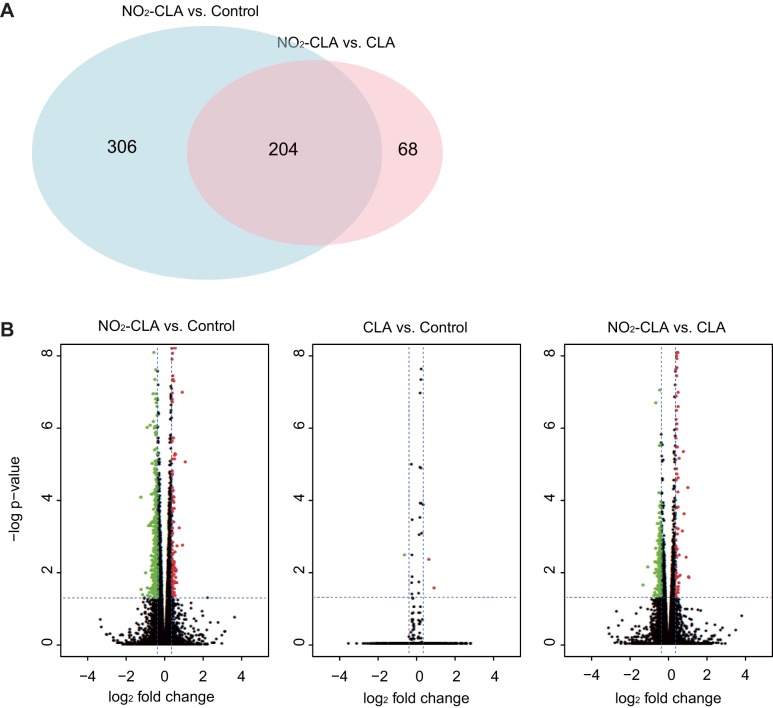
Fig. 1.
Transcriptomic profiling of human coronary artery smooth muscle cells (hCASMCs) treated by nitro-conjugated linoleic acid (NO2-CLA). A: Venn diagram of differentially expressed genes (DEGs) identified in NO2-CLA vs. conjugated linoleic acid (CLA) and NO2-CLA vs. control. B: pairwise volcano plot of gene expression differences between conditions. The threshold of DEGs is defined at false discovery rate (FDR) > 0.05, and 1.3 fold up- (red) or down- (green) regulated upon treatment.

