
Fig. 8.
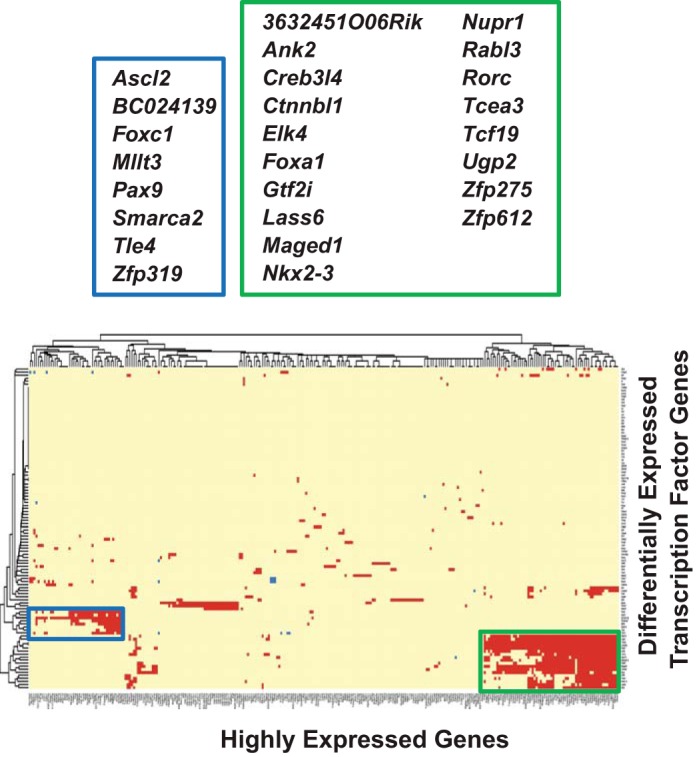
Cluster analysis of highly expressed protein-coding genes (HEGs) vs. differentially expressed transcription factors (DE TFs) in the murine major salivary glands. Heat map and the resulting cluster dendrogram self-organized for the 106 DE TFs vs. 901 HEGs (listed in Supplemental Table S4), based on 18-sample FPKM values. Pairwise Pearson correlation coefficients were calculated with a cut-off of 0.9. Two clusters were evident where 65 and 43 HEGs coexpressed with 18 and 8 DE TFs highly expressed in the SLG (green box) and the PG (blue box), respectively (see Supplemental Table S8).