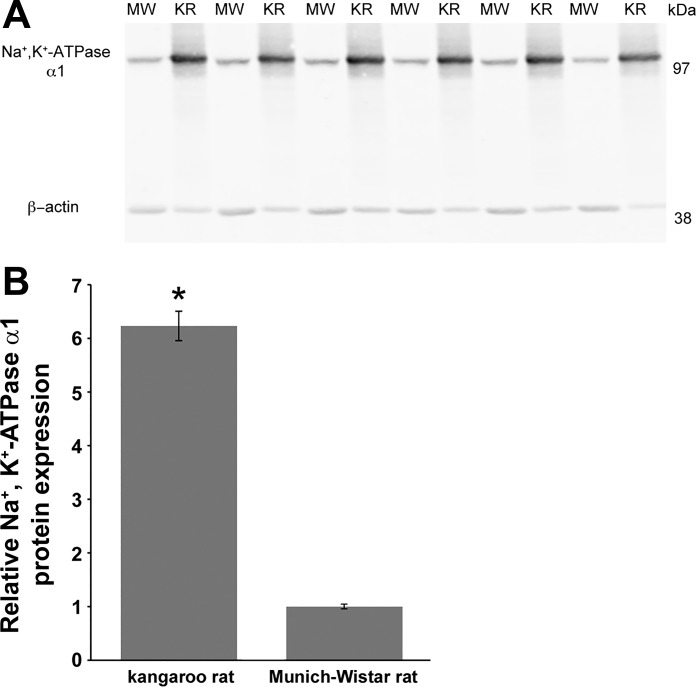
Fig. 4.
Na+-K+-ATPase α1-protein expression in the ISOM of the kangaroo rat (KR) and the Munich-Wistar rat (MW). A: immunoblots with 20 μg of protein applied to each lane; each lane represents a different animal. B: quantification of Na+-K+-ATPase α1 immunoblot normalized to β-actin; n = 6 for each species. Kangaroo rat data are expressed relative to the mean of the Munich-Wistar rat, which was set to 1. *Significant difference in protein expression between species by Student’s unpaired t-test.

