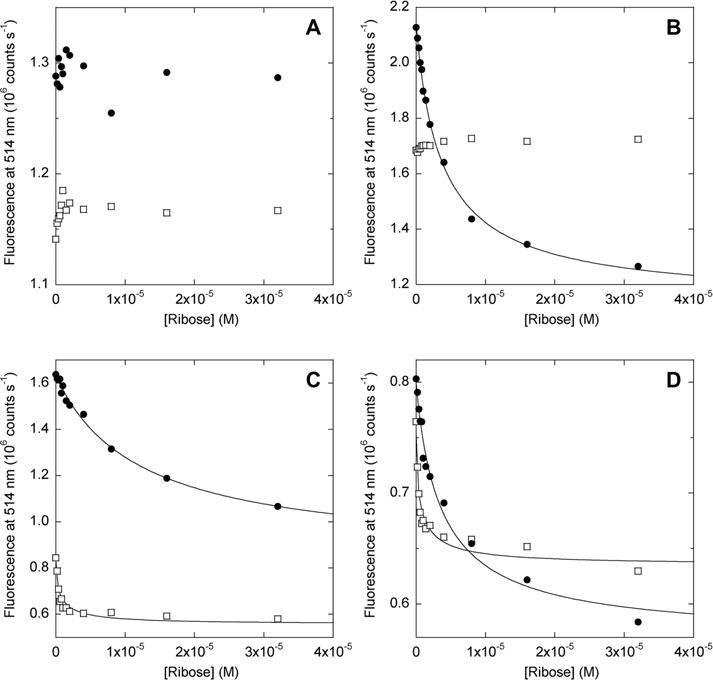
Figure 4.

Ribose binding of AFF biosensors monitored by FRET. Filled circles show data for AFF variants; empty squares show data for N′ analogues. Lines indicate best fits to the single-site binding equation. Samples in each panel and their fitted dissociation constants (where applicable) are as follows: (A) AFF60, N′60; (B) AFF70 (Kd = 4.2 μM), N′70; (C) AFF186 (Kd = 12.3 μM), N′186; (D) AFF210 (Kd = 4.2 μM), N′210. Kd values of N′186 and N′210 are not accurately determined because they are significantly below the protein concentration employed (1 μM). The temperature was 50 °C.
