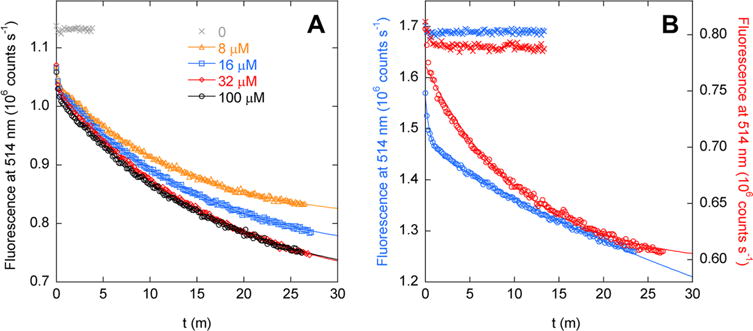
Figure 5.

Kinetics of binding of ribose to (A) AFF70 and (B) AFF186 (blue symbols, left axis) and AFF210 (red symbols, right axis), determined by FRET. Lines are best fits to a single-exponential function (AFF70 and AFF 210) or a double-exponential function (AFF186). Crosses indicate the fluorescence baseline reading in the absence of ribose. Panel A shows that rates of binding of ribose to AFF70 are independent of substrate concentration. Fitted rate constants are (in order of increasing ribose concentration) 0.075, 0.066, 0.058, and 0.062 min−1. In panel B, the ribose concentration is 100 μM and fitted rates are 2.1 min−1 (14% total amplitude) and 0.018 min−1 (86% total amplitude) for AFF186 and 0.092 min−1 for AFF210. The temperature was 50 °C.
