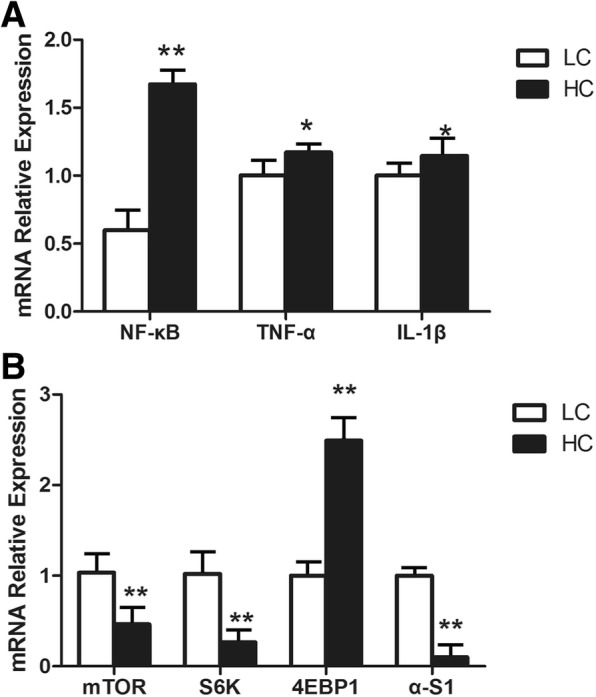
Fig. 3.

mRNA expressions of inflammatory genes and casein synthesis in the mammary glands of dairy cows in the LC and HC groups. a shows the mRNA expression of inflammatory response genes in mammary gland tissue, while (b) shows the mRNA expression of casein synthesis genes. The ordinate axis indicates the relative expression of the genes in mammary gland tissues (n = 6 in each group, mean ± SEM). The white packed column represents the LC group, while the black packed column represents the HC group. The significant differences are indicated (*P < 0.05, **P < 0.01)
