Fig. 1.
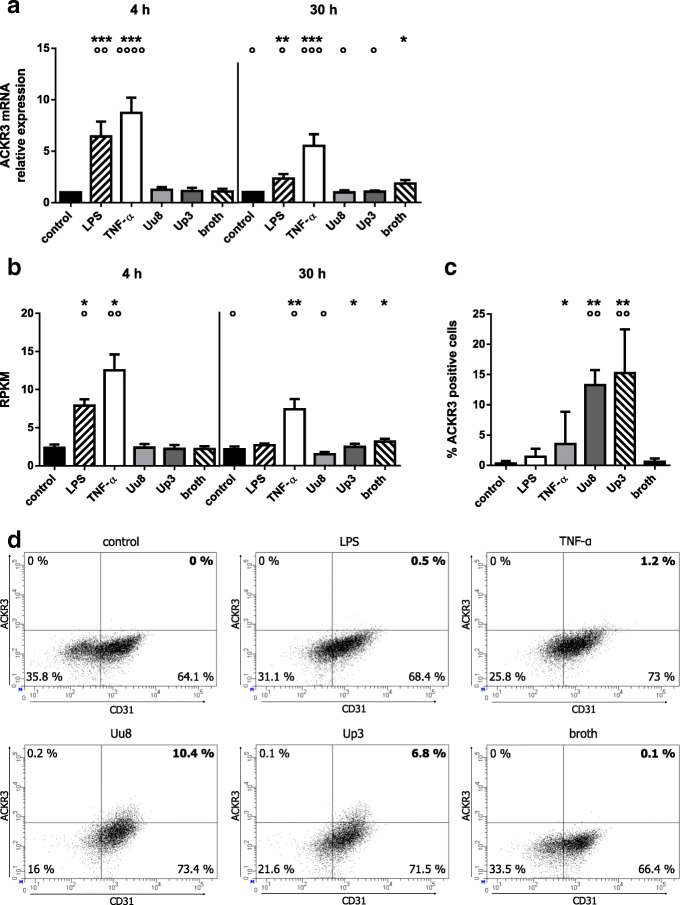
ACKR3 mRNA and protein expression in HBMEC after stimulation with LPS, TNF-α, or Ureaplasma spp. Levels of mRNA were assessed by qRT-PCR (a) and RNA sequencing (b). Flow cytometry was used to determine protein expression, events were gated for vital cells, with CD31 functioning as endothelial marker. For a stimulation period of 48 h, (c) shows the percentage of ACKR3- and CD31-positive cells, whereas dot plots of one representative experiment are given in (d). Data are presented as mean ± SD and significances are reported for comparisons vs. control and vs. broth (p values after logarithmic transformation, *p < 0.05, **p < 0.01, ***p < 0.001 vs. unstimulated control; °p < 0.05, °°p < 0.01, °°°p < 0.001, °°°°p < 0.0001 vs. broth)

