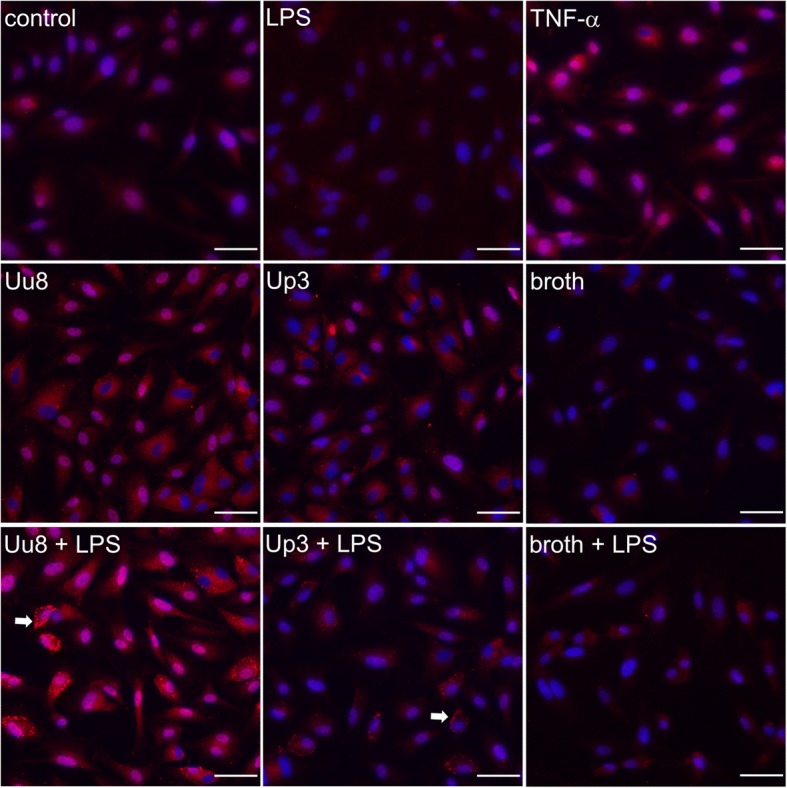
Fig. 3.

ACKR3 immunocytochemistry in native and stimulated HBMEC. Representative images of basal and inflammation-induced ACKR3 (red) expression in HBMEC. Nuclei were visualized with DAPI (blue). ACKR3-positive granules in LPS-primed HBMEC additionally incubated with Ureaplasma spp. are indicated (arrow). Scale bar = 50 μm
