Fig. 5.

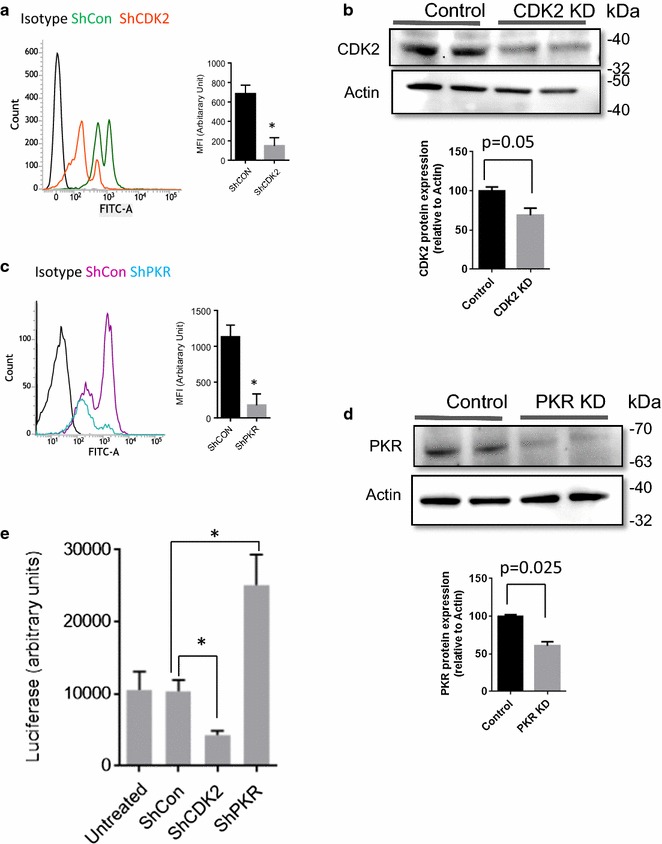
Effect of CDK2 and PKR Knock downs on HIV-1 replication. a–d CDK2 and PKR knockdown were generated in CEM T cells stably transduced with lentiviruses expressing CDK2 or PKR-targeting shRNA, or control non-targeting shRNA. a, c Expression of PKR and CDK2 in CEM T cells respectively determined by FACS analysis. Representative histogram shows isotype antibody staining (black), shRNA control (green or purple respectively) and CDK2 or PKR-targeting shRNA (orange or blue respectively). Bar graph of mean fluorescent intensity (MFI, y axis starts at mean fluorescence intensity of the isotype control; n = 2 per group).Mean ± SD. b, d Protein expression levels of CDK2 and PKR in stable knock down cell lines. Actin was used as normalization control. Bar graphs show the extent of the corresponding protein knock outs normalized to actin. e CEM T cells were infected with HIV-1-LUC-G virus and luciferase activity was measured at 48 h post infection. The mean ± SD are shown. *p ≤ 0.01
