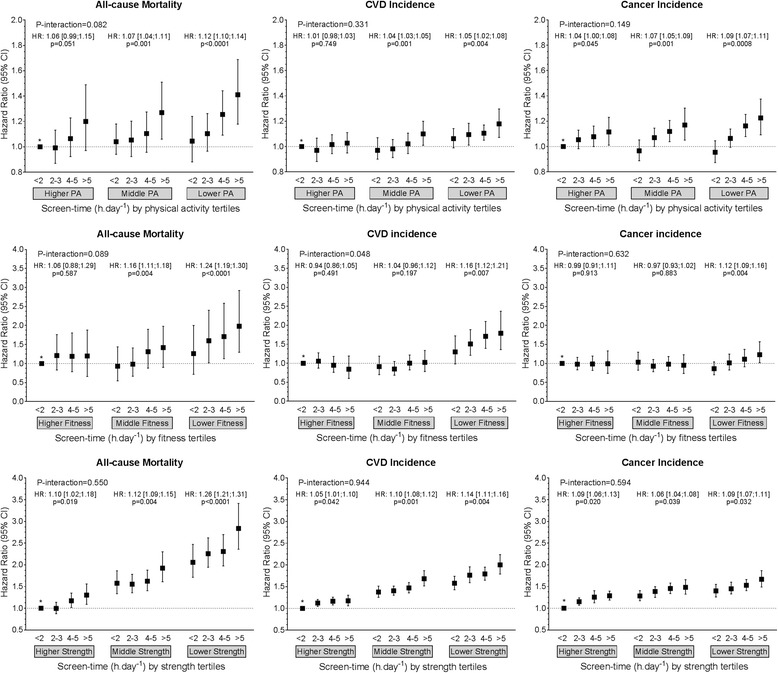
Fig. 2.

Cox proportional hazard models of the association of overall discretionary screen time with all-cause mortality, and incidence of CVD and cancer by physical activity, fitness and handgrip strength strata. Data are presented as adjusted hazard ratio (HR) (95% CI). Reference category was defined as those participants with < 2 h.day− 1 of screen time and who were in the highest tertile for physical activity, fitness or grip strength. Within-tertile HR trends, with p values for these trends also shown for each physical activity, fitness and physical activity strata. P-interaction indicates the p value for the interaction between screen time and tertile of physical activity, fitness or strength. CVD cardiovascular disease, CI confidence interval, HR hazard ratio, PA physical activity
