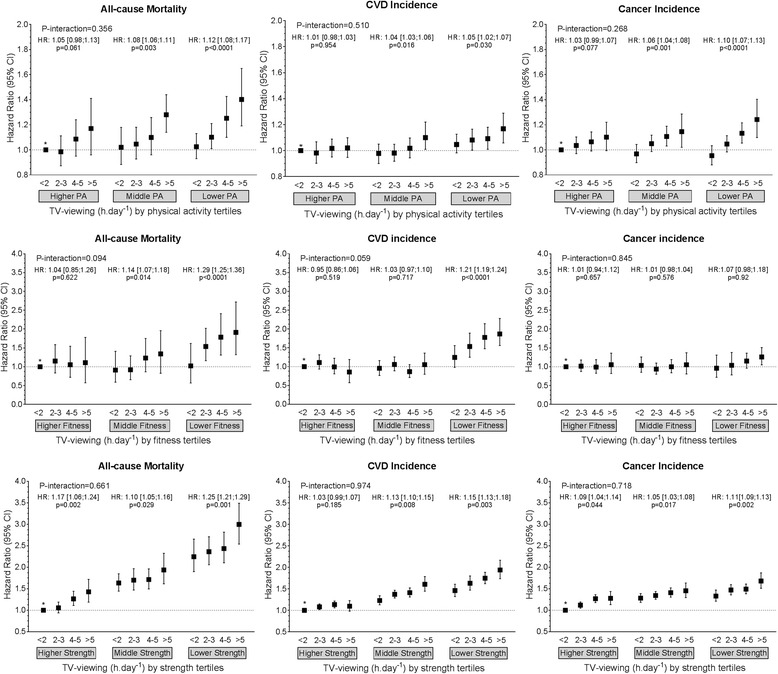
Fig. 3.

Cox proportional hazard models of the association of TV viewing with all-cause mortality, and incidence of CVD and cancer by physical activity, fitness and handgrip strength strata. Data presented as adjusted hazard ratio (HR) (95%CI). Reference category was defined as those participants with < 2 h.day− 1 of TV viewing and who were in the highest tertile for physical activity, fitness or grip strength. Within-tertile HR trends, with p values for these trends also shown for each physical activity, fitness and physical activity strata. Analyses were adjusted for age, sex, ethnicity, deprivation index, professional qualifications, income, employment, smoking status, sleep duration categories, dietary intake (alcohol, red meat, processed meat, fruit and vegetable and oily fish intake), systolic blood pressure, prevalent diabetes, hypertension and medication for diabetes, hypertension, and cholesterol. Analyses were all performed as landmark analysis with follow-up commenced 2 years after recruitment and only including participants who were event-free at this time. Participants with comorbidities at baseline were excluded from all-analysis (n = 103,755). P-interaction indicates the p value for the interaction between T-viewing and tertile of physical activity, fitness or strength
