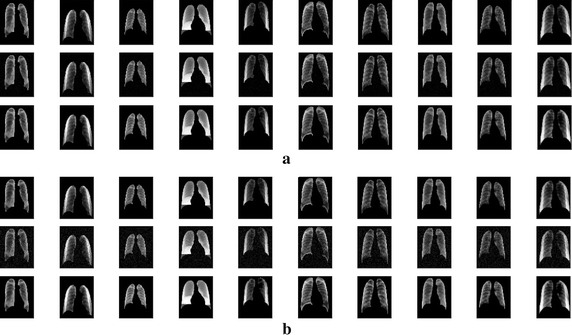
Fig. 6.

Original lung image and reconstructed lung image from CSDAE. a Results of CSDAE with noise factor 0.01: the upper row is the original image, middle row is the image with noise, and bottom row is the reconstructed image. b Results of CSDAE with noise factor 0.05: the upper row is the original image, middle row is the image with noise, and bottom row is the reconstructed image
