Fig. 4.

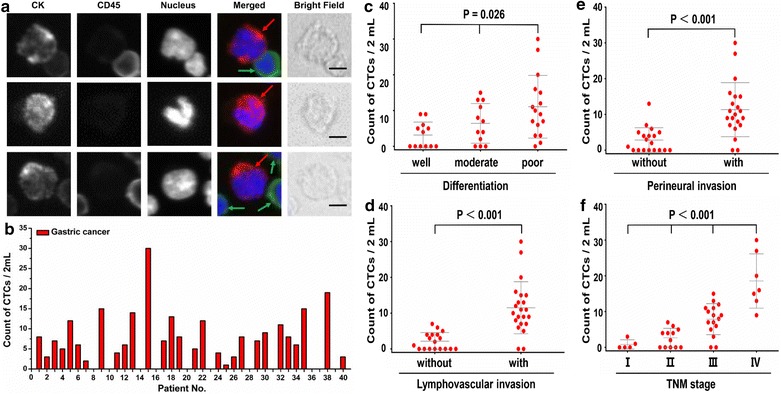
Result of CTCs isolation from 40 GC patients. a CTCs detected from a GC patient. Three-color immunocytochemistry method based on CK, CD45, and nuclear staining was applied to identify and enumerate CTCs (red arrow) from non-specifically trapped WBCs (green arrow). Scale bars are 10 μm; b CTCs enumeration results obtained from 40 GC patients. Scatter plot for CTCs number of GC patients; c different tumor differential status; d with and without lymphovascular invasion; e with and without perineural invasion; f different TNM stage, each red dot stands for one GC patient. The error bars represent standard error of the mean
