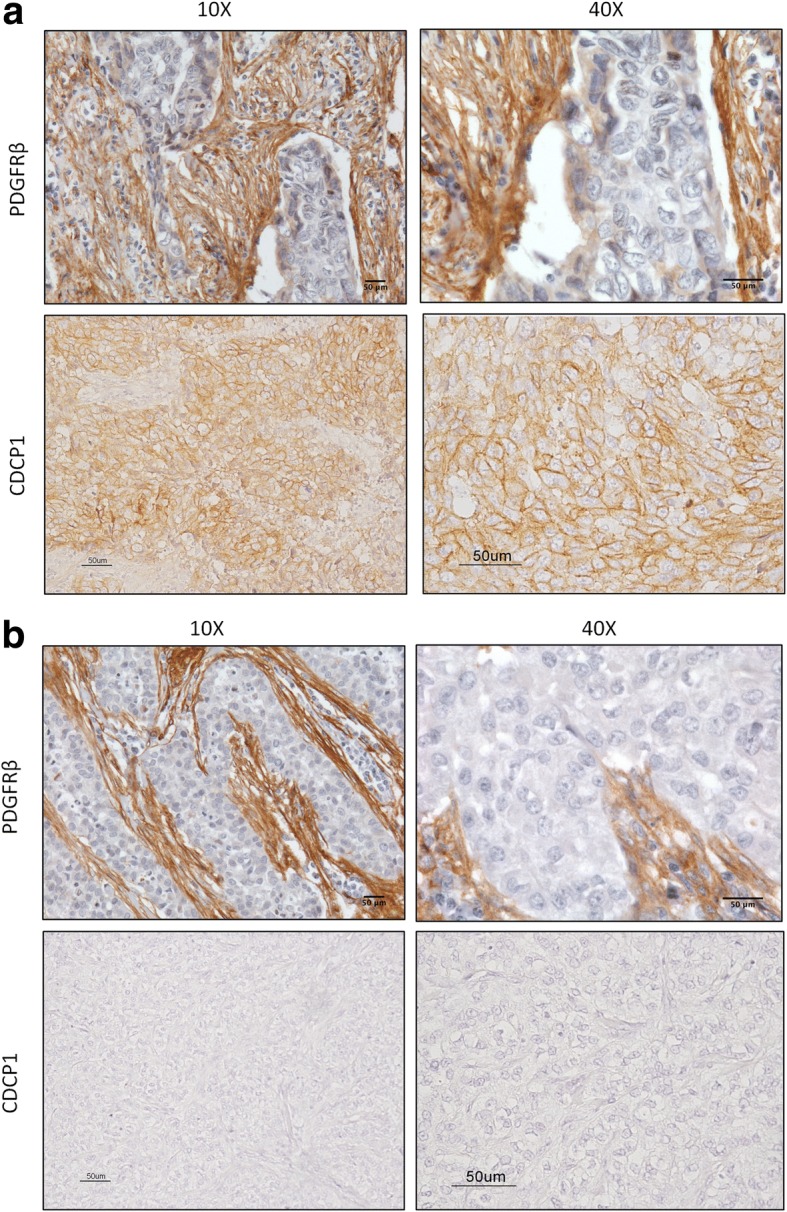
Fig. 5.

IHC staining of PDGFRβ and CDCP1 in TNBC. FFPE sections of TNBC specimens were analyzed by IHC for PDGFRβ and CDCP1. a Representative image of a PDGFRβ- and CDCP1-positive case, with plasma membrane staining, at 10X and 40X magnification; b Representative image of a PDGFRβ- and CDCP1-negative case, at 10X and 40X magnification
