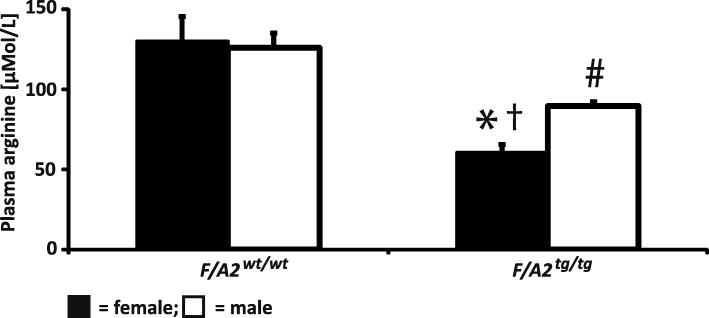
Fig. 1.
Decline of plasma arginine concentrations in female and male F/A2tg/tg mice. Black bars represent female and white bars male mice. Means ± SEM of 7–8 mice per group. Significance symbols: * = P < 0.01 F/A2tg/tg mice vs. F/A2wt/wt (females); # = P < 0.01 F/A2tg/tg mice vs. F/A2wt/wt (males); † = P < 0.05 female vs. male F/A2tg/tg mice

