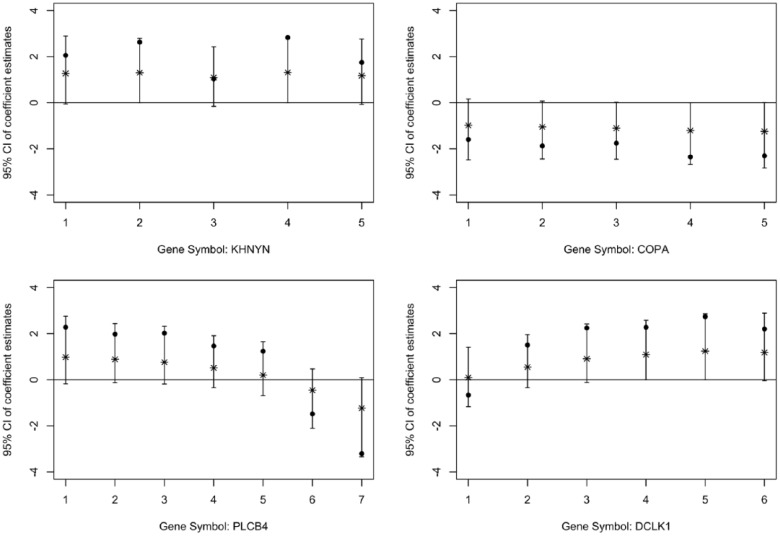
Figure 2.
Examples of effect estimates for SNPs within 4 genes identified by the HSVS. The x-axis represents the index of SNPs in an order that reflects the relationship of their adjacent positions in that particular gene. The solid black dot indicates the z score of the association test. The asterisk indicates the posterior median. The vertical line indicates the 95% credible interval. The horizontal line indicates the marker for 0.

