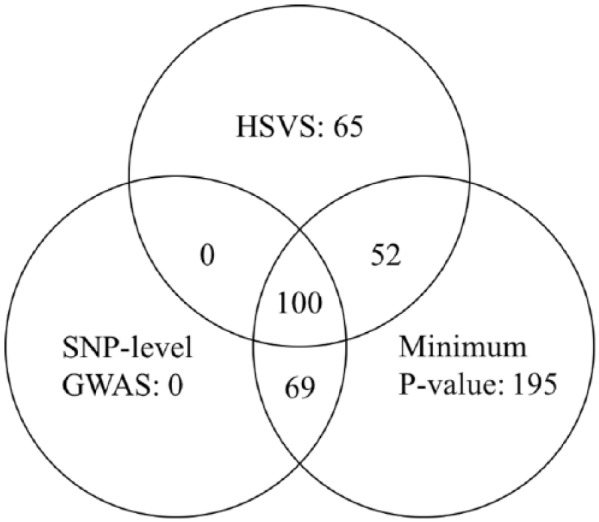
Figure 3.

The Venn diagram that shows the number of significant genes identified by the HSVS method, the SNP-level GWAS with the Benjamini-Hochberg procedure, and the minimum P value method with with the Benjamini-Hochberg procedure. The number in each nonoverlapping region is the number of genes exclusively identified by that particular method. For example, the HSVS method was able to identify 65 genes not identifiable by the other 2 methods. GWAS indicates genome-wide association study; HSVS, hierarchical structured variable selection; SNP, single-nucleotide polymorphism.
