Figure 2.
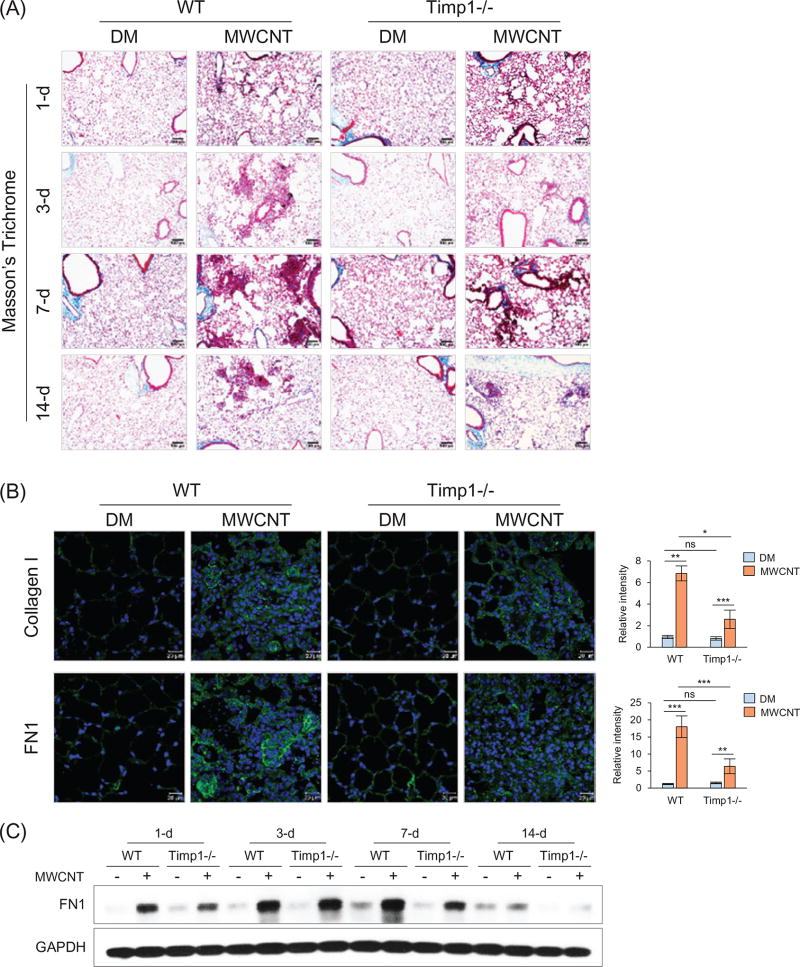
Reduced fibrosis in Timp1 KO lungs. WT and Timp1 KO mice received DM or MWCNTs (40 µg). (A) Masson’s Trichrome staining. Time course is shown. Scale bar: 100 µm. (B) Collagen I (upper panel) and FN1 (lower panel) immunofluorescence staining (green indicates positive staining, blue represents nuclear staining) on lung sections from mice sacrificed on day 7 post-exposure. Scale bar: 20 µm. Relative intensity is shown as the mean ± SD (n = 4). (C) Immunoblotting of FN1. Lung proteins from randomly selected samples of each group were analyzed and a representative blotting image is presented.

