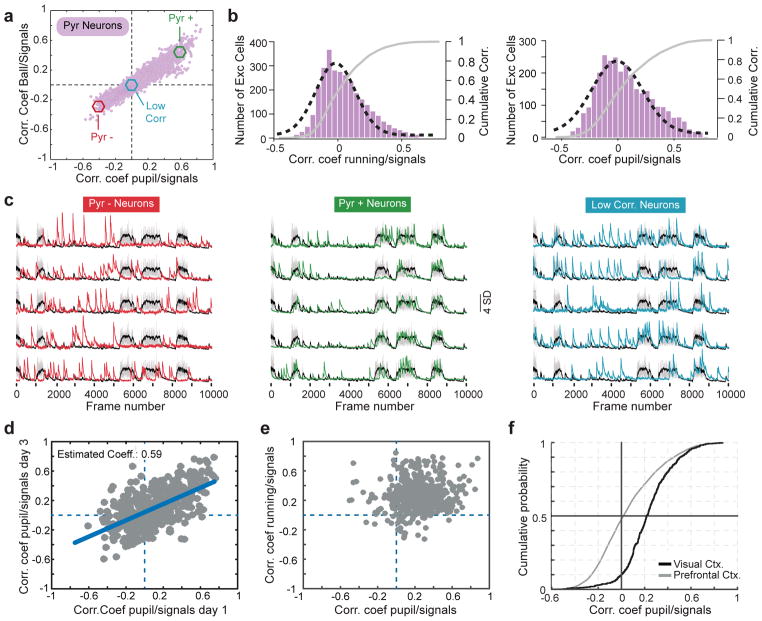
Figure 1. A stable subset of excitatory neurons is inhibited during arousal.
a) Ordinate: plot of the correlation coefficients between excitatory response and locomotion. Abscissa: plot of the correlation coefficients between those same neurons and pupil diameter. 3108 neurons, 11 mice, 17 fields of view. Neurons with a P value < 0.0001 for each coefficient: 1175 negatively correlated to pupil diameter; 1193 negatively correlated to running; 1559 positively correlated to pupil diameter; 1643 positively correlated to running; 1350 positively correlated with both pupil and running; 1020 negatively correlated with both pupil and running; Remaining cells were not significantly correlated with either measure.
b) Histograms plotting excitatory correlation coefficients to running (left) and pupil diameter (right). A Gaussian distribution was fitted to each histogram (black dashed line). Gray lines in both show the cumulative distributions.
c) Example traces from 5 excitatory neurons whose activities are negatively (red, left), positively (green, middle), or un-correlated (blue, right) with locomotion/pupil diameter. Cells were taken from the pool of neurons shown in the colored circles in panel c.
d) Plot of correlation coefficients between pyramidal cell responses and pupil diameter for the same 440 pyramidal neurons imaged on two time points that were 3 days apart. 440 neurons, 5 mice, 5 fields of view. Error degrees of freedom = 438; Root mean squared error = 0.198; R-squared = 0.375; t-statistic = 16.2; F-statistic vs. constant model: 263, p = 1.17e-46. Significance of the linear regression was determined using a 2-sided t-statistic with n-2 degrees of freedom.
e) Same plot as in (a), but for pyramidal neurons imaged in primary visual cortex. 518 neurons, 5 mice, 5 fields of view. 53 negatively correlated to pupil diameter; 31 negatively correlated to running; 5 negatively correlated to both pupil diameter and running.
f) Cumulative distributions of coefficients to pupil diameter for neurons in V1 and FrA.

