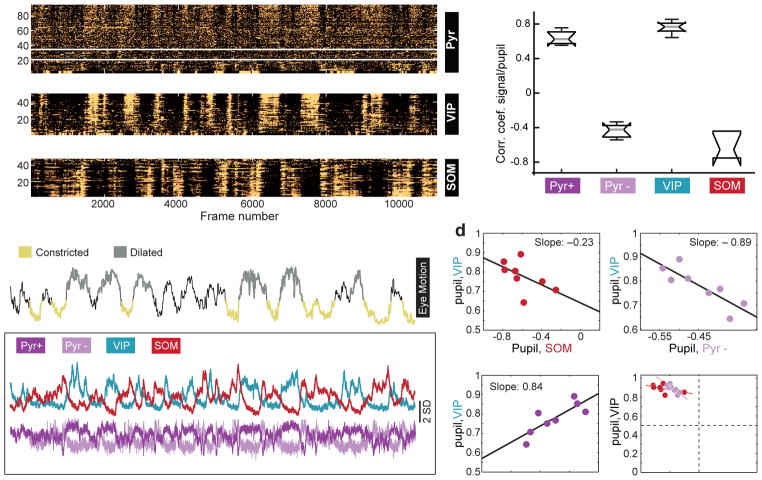
Figure 2. Co-variation of coefficients between VIP and Pyr cells across mice.
a) 3 panels showing z-scored time series responses of 95 excitatory neurons (top), 50 VIP cells (middle), and 48 SOM cells (bottom) imaged in the same mouse over 13 minutes. For the excitatory neurons, responses above and below the white lines are significantly positively and negatively correlated, respectively, with pupil size. Mice are triple transgenic SOM-Cre;VIP-Cre;Ai9.
b) Top trace: z-scored time series for the pupil diameter in the same mouse shown in panel a. Regions of the trace representing “constricted” or “dilated” pupil are color coded and represent regions that remained significantly above or below the mean for a duration of greater than 3 seconds. The traces in the lower boxed region show the mean response of the Pyr+ and Pyr– neurons, VIP and SOM cells in panel a.
c) Box plots of the distribution of correlation coefficients of mean responses for each group of cells to pupil. Whiskers define median, upper quartile, lower quartile, upper adjacent value, and lower adjacent value. n=747 pyramidal neurons, 357 VIP cells, 204 SOM cells, 4 mice, 8 fields of view.
d) Co-variation across animals of correlation coefficients among population activity and pupil size.
VIP-Pyr+: t-stat: 3.44; root mean squared error = 0.05; R-squared = 0.608, F-statistic vs. constant model: 11.9, p=0.0139; 6 degrees of freedom.
VIP-Pyr–: t-stat: −3.9; root mean squared error = 0.045; R-squared = 0.671; F-statistic vs. constant model: 15.3, p=0.0079; 6 degrees of freedom.
VIP-SOM: t-stat: −1.57; root mean squared error = 0.072; R-squared = 0.173; F-statistic vs. constant model: 2.47, p =0.167. Plots are of fields of view. Significance of the linear regression was determined using a 2-sided t-statistic with n-2 degrees of freedom.

