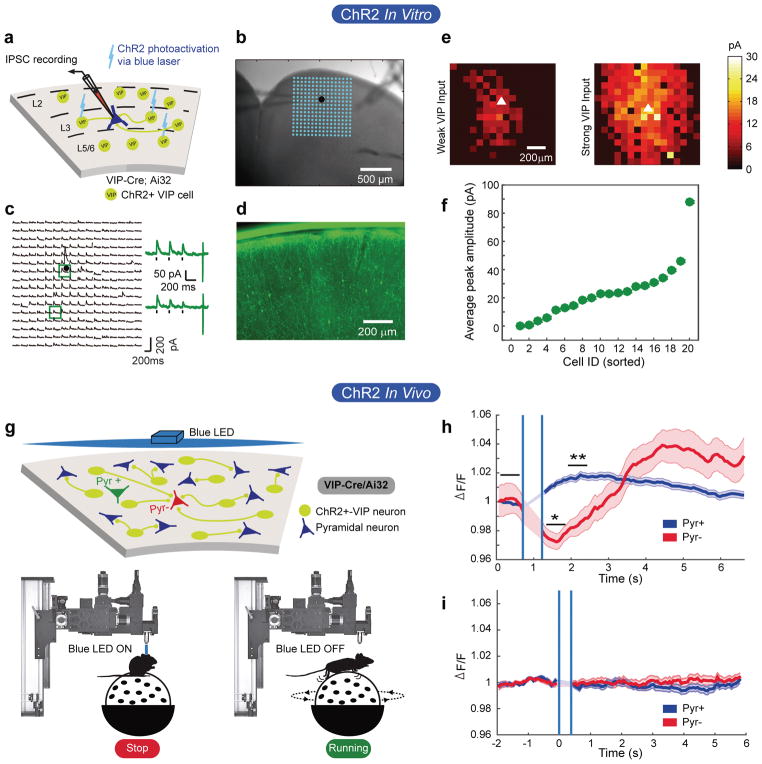
Figure 3. VIP cells act as a push-pull circuit in vivo.
a) Schematic of the approach used to map VIP cell-derived inhibitory post-synaptic currents in pyramidal neurons patched in layer 2/3 of FrA.
b) Brightfield image of a brain slice. The patch pipette can be seen entering from the left. The position of the patched cell is indicated by the black dot. The blue dots show the positions of each photostimulation site.
c) Inhibitory postsynaptic currents evoked from each photostimulation site. Responses evoked from stimulation at the two sites outlined by the blue squares are shown to the right.
d) Fluorescent image of section showing expression of YFP-tagged ChR2 in VIP interneurons. Scale bar is 200 micrometers.
e) Examples of a weak and strong heat map of VIP cell-derived inhibitory currents to two different pyramidal neurons.
f) Amplitude of the mean inhibitory current to each of 20 pyramidal neurons from all local VIP cells in the slice.
g) Schematic of experimental setup. Top: VIP cells are represented as yellow/green circles. Pyramidal cells as blue triangles. The green and red triangles represent pyramidal cells that are excited or inhibited during running, respectively. Bottom: Depiction of photostimulation through the objective lens. Stimulation was done when mice were quiescent.
h) Mean z-score of Pyr- responses to ChR2-VIP cell stimulation. Shaded areas define +/− 1 standard error of the responses. Vertical blue lines delineate the time when the LED was turned on and the PMT was gated off. A significant suppression of GCaMP6s response in the Pyr- cells occurs in ~575ms. P values result from Wilcoxon rank-sum test; 345 cells, 4 fields of view, 2 mice; Pyr+ = 6.14e-14; Pyr- = 0.024.
i) Same measure as in panel h, but in a mouse lacking ChR2 in VIP cells. 168 cells, 2 fields of view, 1 mouse.

