Figure 6.
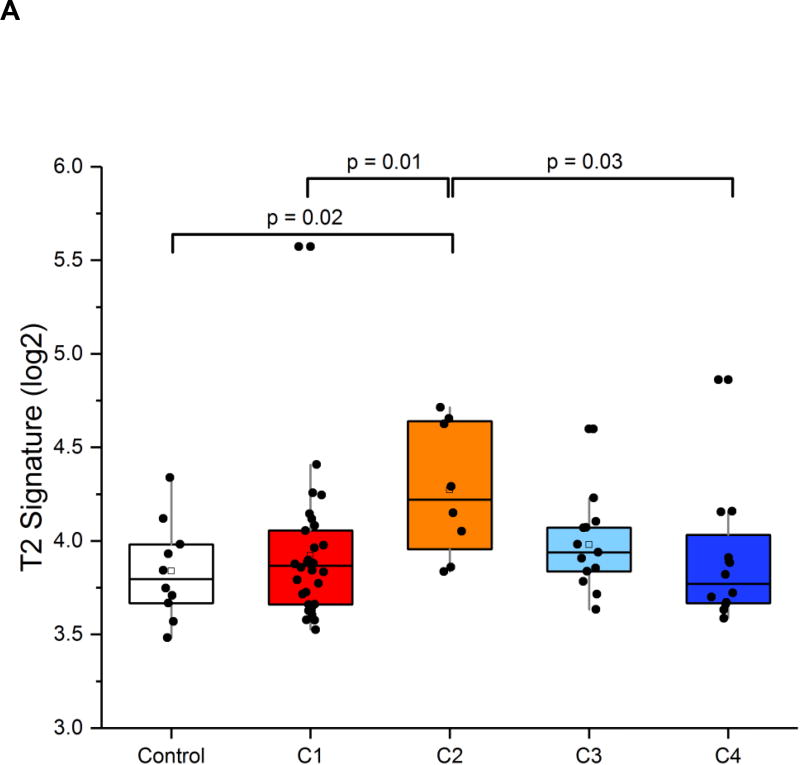
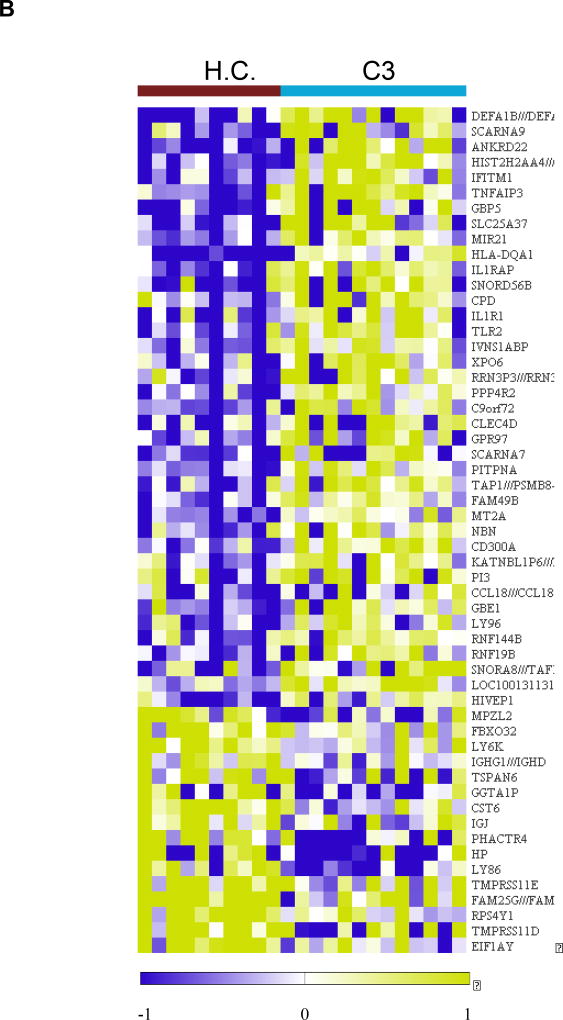
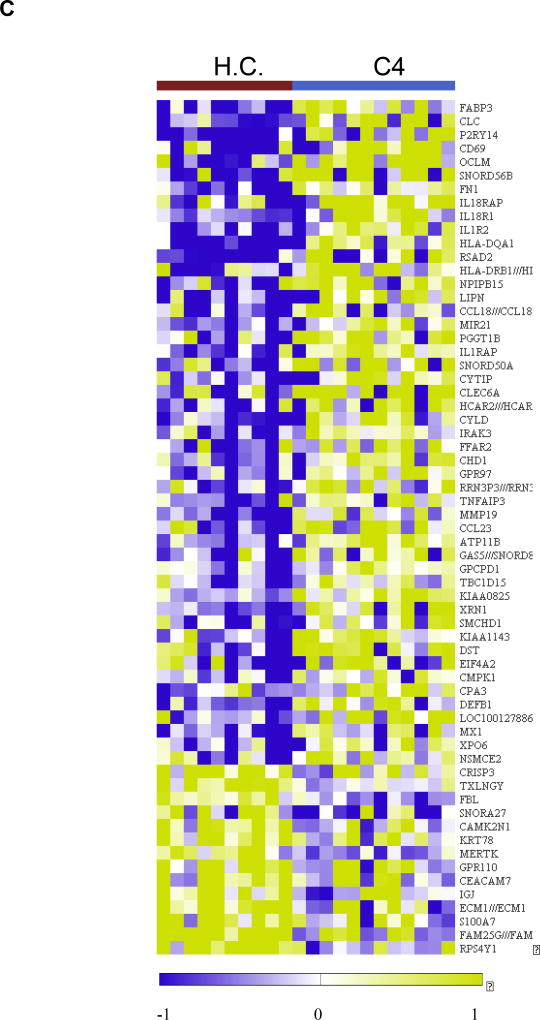
Analysis of the sputum transcriptome in the YKL-40 clusters and healthy controls in the YCAAD cohort. A: Mean T2 gene expression levels (IL-4, -5, and -13) among the YKL-40 clusters demonstrate lower levels of T2 gene expression in C3 and C1 and C4. B: Heatmap of the sputum gene expression in C3 compared to healthy controls (HC) shows activation of innate immunity pathways and the NETosis pathway. C: Heatmap of the sputum gene expression in C3 compared to HC shows activation of the IL-1 and IL-18 pathways in C4.


