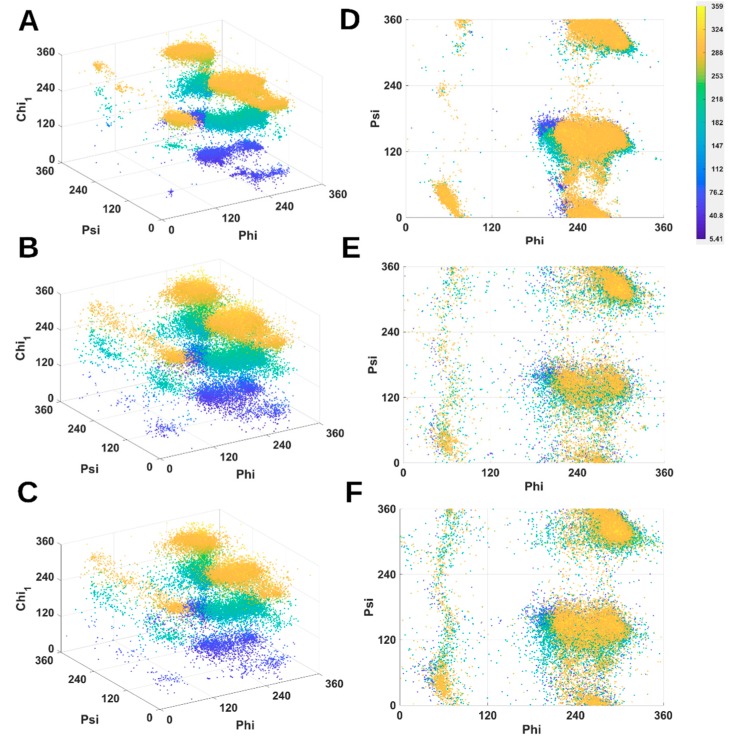
Figure 1.
3D scatter plots and Ramachandran plots of Arginine (ARG) residue for three data sets. 3D scatter plots of (φ, ψ, χ1) are shown for X-ray-1.5 data set (A); EM-2-4 data set (B); and EM-4-6 data set (C); Ramachandran plots of (φ, ψ) are shown for X-ray-1.5 data set (D); EM-2-4 data set (E); and EM-4-6 data set (F). The color code (shown) is based on , and it is the same for each panel.

