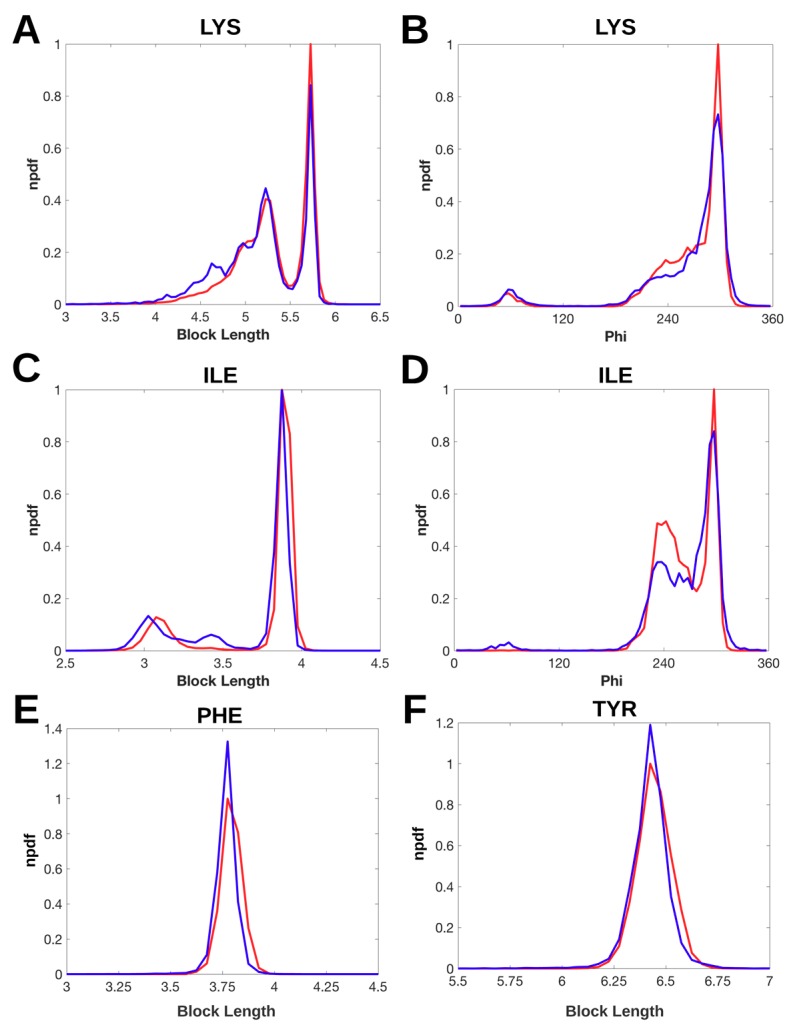
Figure 2.
Normalized probability density function of block length and torsion angle φ. The distribution of block length and φ is shown respectively as a probability density function (npdf) normalized by the highest peak of the pdf of the X-ray-1.5 data set. The npdf of X-ray-1.5 data set (red line) and the npdf of EM-2-4 data set (blue line) are shown for lysine (LYS) (A,B); isoleucine (ILE) (C,D); phenylalanine (PHE) (E); and tyrosine (TYR) (F) respectively.

