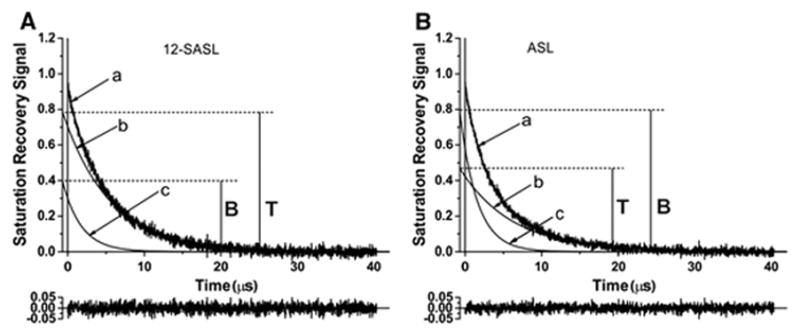
Fig. 6.

Representative SR signals of 12-SASL and ASL in deoxygenated nuclear fiber cell plasma membranes from porcine eye lenses recorded with 30 points removed from the beginning of the dataset (a). These signals can be successfully fitted with only a double-exponential function with time constants of 6.15 ± 0.30 μs (b) and 2.44 ± 0.47 μs (c) for 12-SASL and with time constants of 6.86 ± 0.2 μs (b) and 2.25 ± 0.12 μs (c) for ASL. The residual, shown at the bottom, indicates the goodness of the fit. The contribution of each component to the experimental signal is given by the pre-exponential coefficients obtained from the fitting program. Because the SR signal is recorded with an instrumental delay (in this case 0.1 μs) after the end of the saturating pulse and because of the delay in the applying the fitting program (in our case 0.6 μs), the exponentials for (b) and (c) components have to be extrapolated back (in our case 0.7 μs) to get the actual ratio of their pre-exponential coefficients T/B. In Fig. 6A, (c) signal coming from the bulk plus boundary PLs and (b) signal coming from the trapped PLs is presented. In Fig. 6B, (c) signal coming from the bulk plus CBD Chol and (b) signal coming from the trapped Chol is presented.
