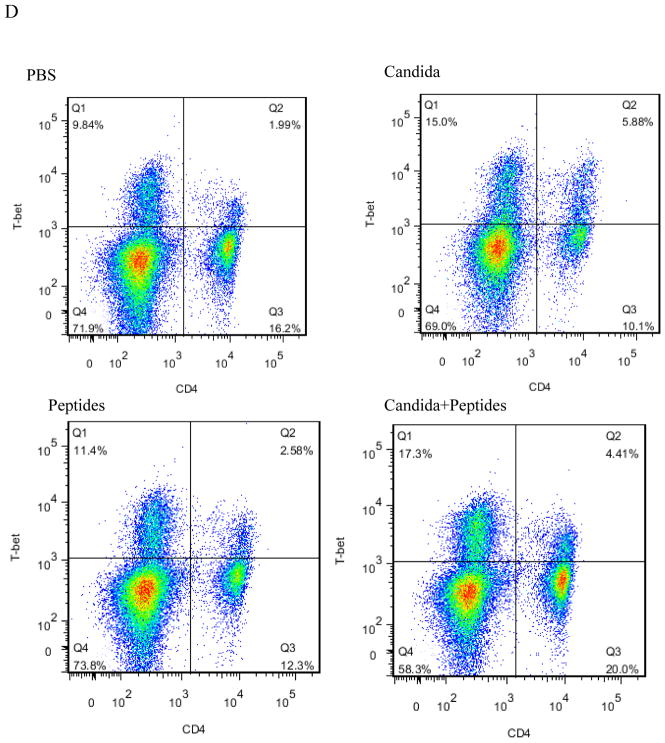
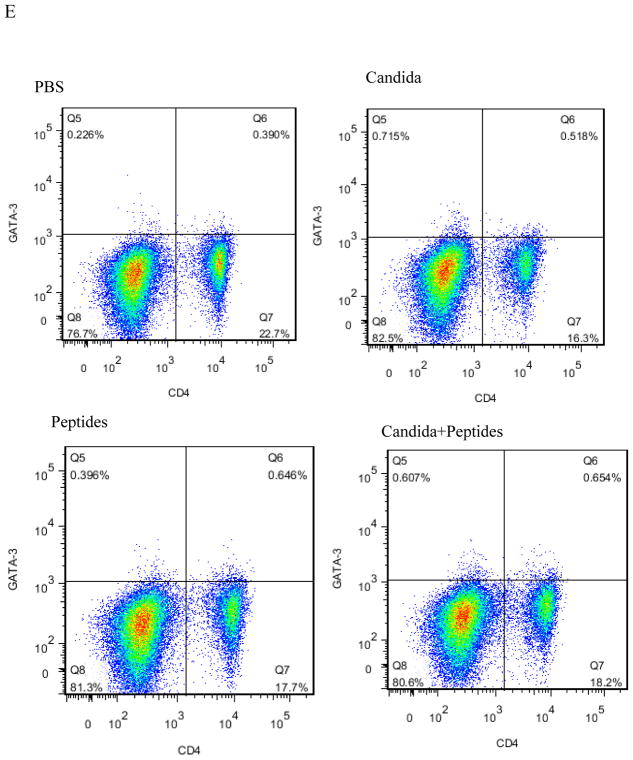
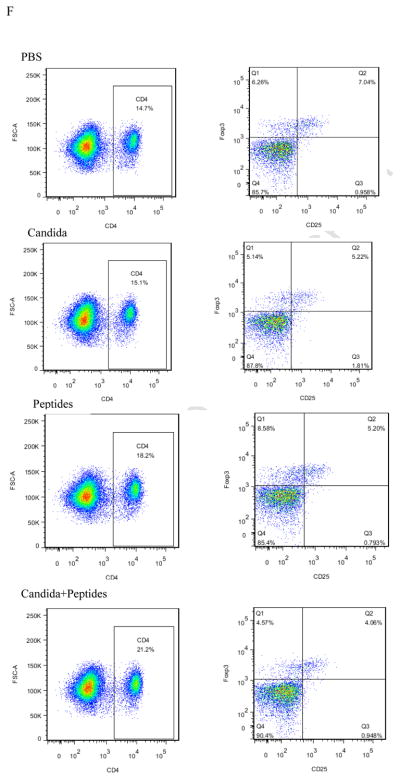
Fig. 4. Induction of Th differentiation.
The intracellular cytokine staining of splenocytes in immunized C57BL mice (n=4) was performed at 2 weeks after the 3rd immunization. The frequency of CD4T-bet+ cells (A), CD4+GATA-3+ cells (B) and CD4+CD25+FoxP3+ cells (C) are shown. Representative dot plots from one mouse (out of four mice) for CD4+T-bet+ cell (D), CD4+GATA-3+ cells (E), and CD4+CD25+FoxP3+ cells (F) are shown respectively. Data are shown as mean ± s.d. Statistically significant differences (p < 0.05) are indicated.


