Figure 2.

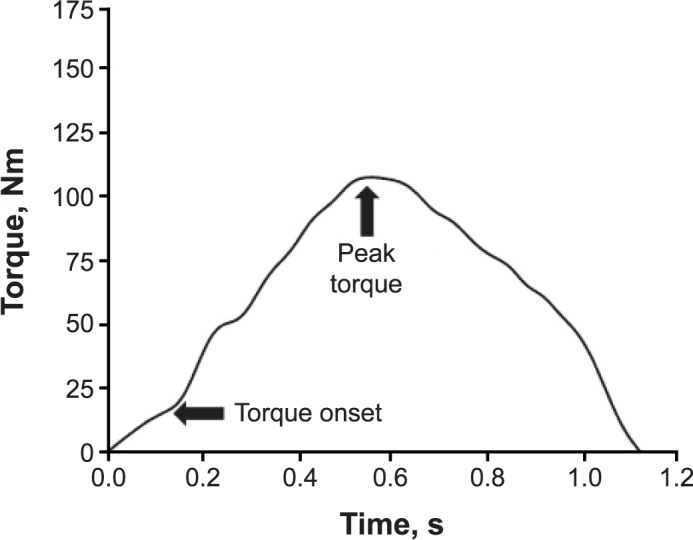
A single trial of isokinetic knee-extension torque data from participant X. Arrows indicate torque onset and peak torque. Rate of torque development and time to peak torque were calculated on the curve bounded by arrows.

A single trial of isokinetic knee-extension torque data from participant X. Arrows indicate torque onset and peak torque. Rate of torque development and time to peak torque were calculated on the curve bounded by arrows.