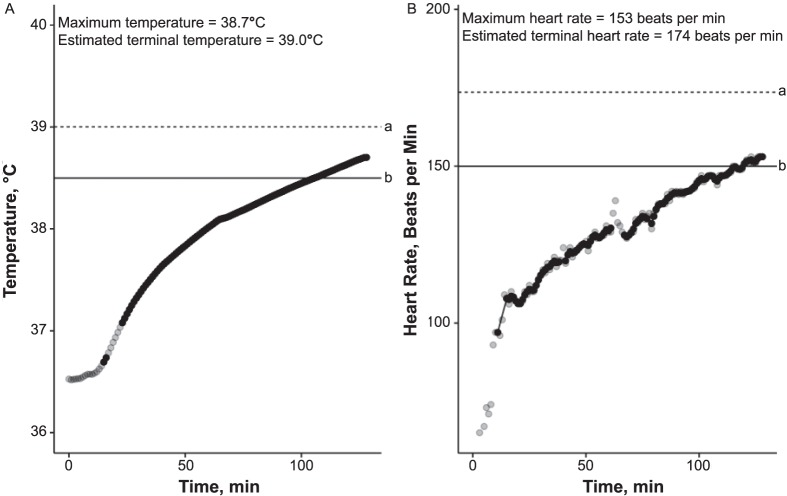
Figure 2.
Representative values for an individual with heat intolerance (probability of heat tolerance = 0): A, Temperature; B, Heart-rate curves. All points on each graph represent 1 measurement; points appear black when several overlap. a Indicates estimated terminal value. b Indicates cutoff value.

