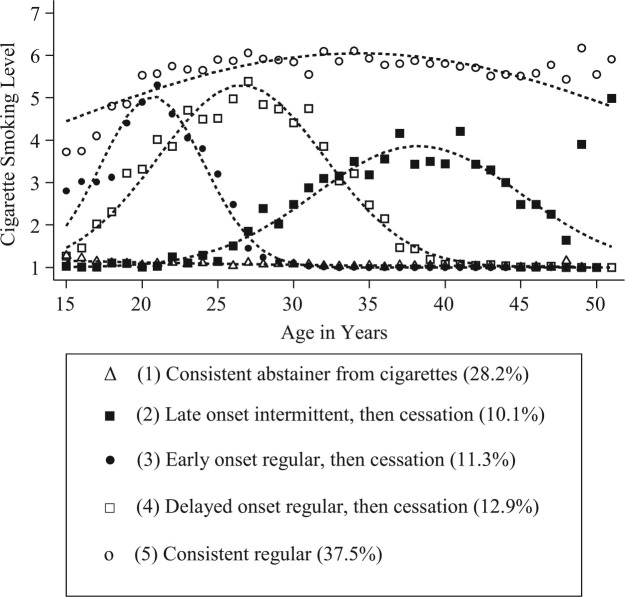
Figure 1.
Trajectories of cigarette smoking. Note: The points represent calculated average cigarette smoking scores for participants at a fixed age within one trajectory group. The large deviation of the observed points from the fitted values for the late onset intermittent, then cessation group is a result of small sample sizes at ages 49 and above that produce low precision of estimation.

