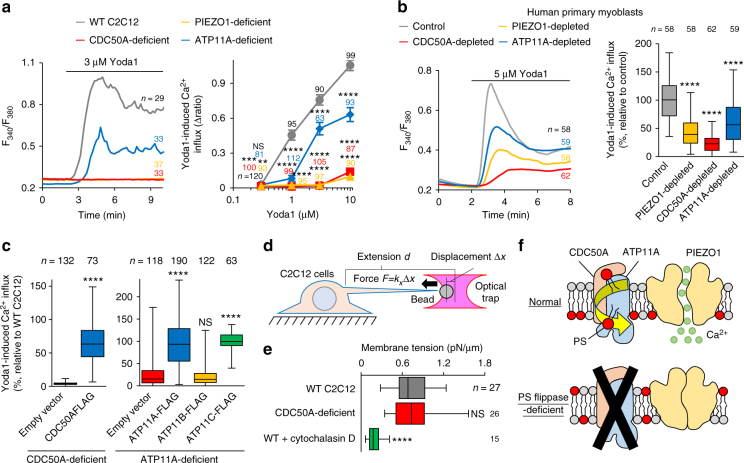
Fig. 3.
Impaired PIEZO1 activation in PS flippase-deficient myoblasts. a, b Suppression of agonist-induced PIEZO1 activation by PS flippase deficiency. a Left: Fura2 ratiometric measurements (F340/F380) of Yoda1-induced Ca2+ influx in WT, PIEZO1-deficient, CDC50A-deficient, and ATP11A-deficient C2C12 myoblasts. Right: quantification of Yoda1-induced Ca2+ influx as the maximal increment of F340/F380 (∆ ratio) in left. b Left: Fura2 ratiometric measurements of Yoda1-induced Ca2+ influx in human primary myoblasts transfected with control, PIEZO1, CDC50A or ATP11A siRNA. Right: quantification of Yoda1-induced Ca2+ influx in left. c Rescue of agonist-induced PIEZO1 activation in PS flippase-deficient myoblasts by overexpression of PS flippase complex components. Quantification of Yoda1-induced Ca2+ influx in CDC50A-deficient (left) or ATP11A-deficient (right) C2C12 myoblasts expressing FLAG-tagged CDC50A, ATP11A, ATP11B or ATP11C. d, e Normal plasma membrane tension in PS flippase-deficient myoblasts. d Schematic model of membrane tension measurement using an optical trap. e Quantification of membrane tension in WT, CDC50A-deficient and cytochalasin D-treated WT C2C12 cells. f Schematic model showing PS flippase-mediated inward translocation of cell surface-exposed PS as a prerequisite for PIEZO1 activation. **P < 0.01, ***P < 0.001, and ****P < 0.0001 (Student’s t-test). NS not significant, n sample number. Box and whiskers graph―line: median, box: upper and lower quartiles, whiskers: maxima and minima

