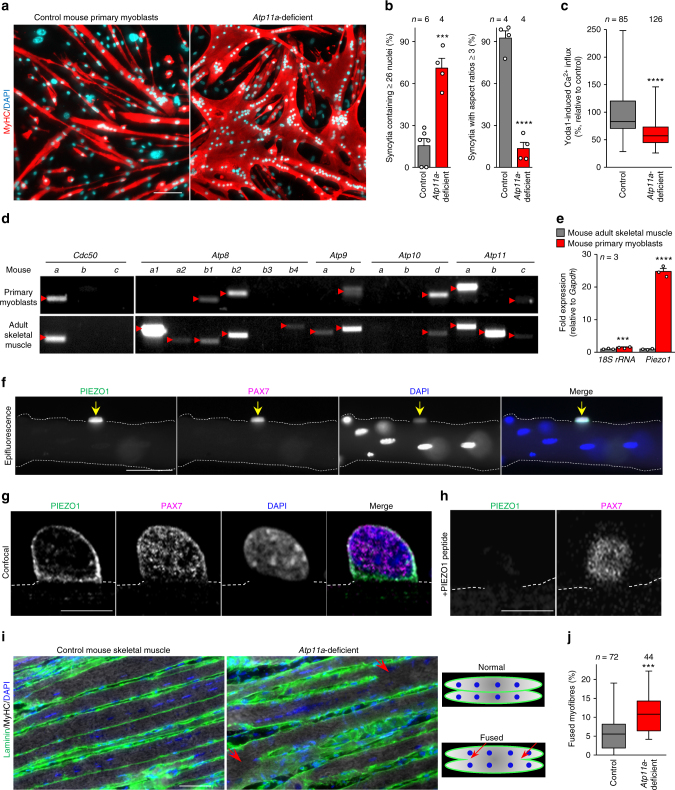
Fig. 8.
A role of ATP11A in morphogenesis during myofibre regeneration. (a, b) a Aberrant morphologies of Atp11a-deficient primary myotubes. Syncytia formed by control or Atp11a-deficient mouse primary myoblasts were visualized by immunofluorescent staining with anti-MyHC antibody (differentiated cells, red) and DAPI (nuclei, cyan). b Left: cell fusion evaluated as percentages of syncytia containing ≥26 nuclei in a. Right: polarized elongation evaluated as percentages of syncytia with aspect ratios ≥3 in a. c Suppression of agonist-induced PIEZO1 activation in Atp11a-deficient mouse primary myoblasts. Quantification of Yoda1-induced Ca2+ influx in control or Atp11a-deficient mouse primary myoblasts. d Semi-quantitative RT-PCR analysis of CDC50 family members and P4-ATPases in mouse primary myoblasts (upper panels) and adult skeletal muscle (lower panels). Arrowheads denote specific bands. e Expression levels of Piezo1 in mouse primary myoblasts and adult skeletal muscle, evaluated by quantitative RT-PCR. Gapdh and 18S rRNA were used as internal controls. f–h Detection of endogenous PIEZO1 protein in satellite cells. Epifluorescence (f) and confocal (g, h) images of mouse myofibres visualized by immunofluorescent staining with anti-PIEZO1, anti-PAX7 antibodies and DAPI (nuclei). Specificity of the anti-PIEZO1 antibody was confirmed by the decreased fluorescence signal in the sample treated with the epitope peptide (h). Arrows indicate Pax7-positive satellite cells. Dashed lines indicate the cell periphery of myofibres. i, j Aberrant morphologies of Atp11a-deficient regenerated myofibres after cardiotoxin-induced muscle degeneration. i Longitudinal sections prepared from control (left) and Atp11a-deficient adult muscle (right) were probed with anti-laminin antibody (green), anti-MyHC antibody (grey), and DAPI (nuclei, blue). Arrows indicate apparent fusion sites with neighboring myofibres. j Evaluation of fused myofibres in i. ***P < 0.001 and ****P < 0.0001 (Student’s t-test). NS not significant, n sample number. Bar graphs represent mean ± S.E.M. Box and whiskers graph-line: median, box: upper and lower quartiles, whiskers: maxima and minima. Scale bars: 100 μm (a), 50 μm (f, i), 10 μm (g, h)

