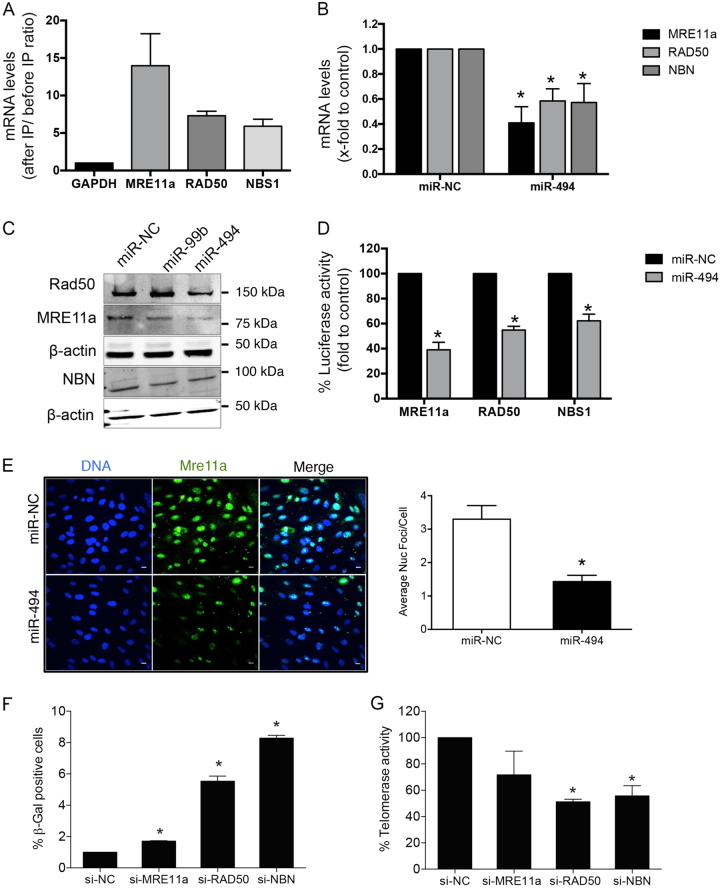
Fig. 3. miR-494 targets the MRN complex in ECs.
a miR-TRAP immunoprecipitation. Bars depict mean + SEM of mRNAs bound to the RISC complex quantified by qRT-PCR in HEK-293T cells transfected with miR-494 for 24 h. b qRT-PCR depicting target mRNA levels in HUVECs transfected with either miR-negative control or miR-494. Bars show mean + SEM of the three MRN complex members. c Representative western blot of MRE11a, RAD50, and NBN after 48 h transfection of indicated miRs in HUVECs. d Luminescence from 3’-UTR-luciferase constructs for MRE11a, RAD50, and NBN 24 h after transfection with miR-494. Graph represents mean + SEM of three independent experiments. e HUVECs were plated on glass coverslips and 24 h later transfected with either miR-494 or miR-negative control. After 48 h, cells were fixed and stained with MRE11a antibody. Scale bar represents 10 µm. Bar graph depicts average foci/ cell + SEM. f β-Gal assay and g telomerase activity in HUVECs transfected for 48 h with specific siRNAs against MRE11a, RAD50, and NBN, or an siRNA-negative control. Bars depict % mean + SEM. *P < 0.05; two-tailed Student’s T-test

