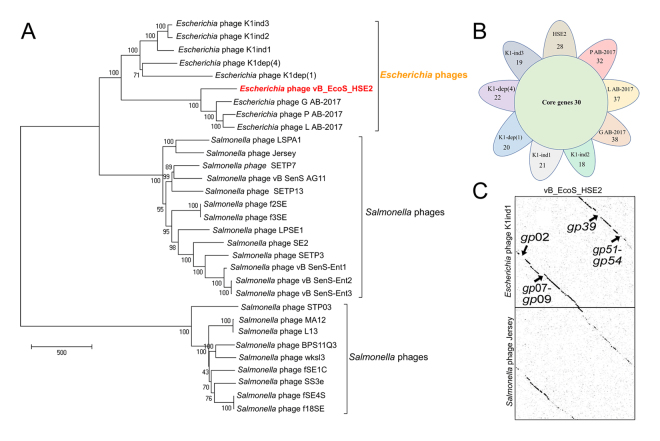
Figure 6.
Phylogenetic and comparative genomic analysis of the phage vB_EcoS_HSE2. (A) Phylogenetic analysis of phages that showed similarity with the phage vB_EcoS_HSE2. The phage genomes that showed similarity higher than 20% with the genome of phage vB_EcoS_HSE2 were collected and used for phylogenetic tree construction. (B) Core-genome analysis of phages from the same evolutionary branch with phage vB_EcoS_HSE2. The numbers of core genes for the 9 phages were indicated in the central circle, and the number of specific genes were also shown. (C) Dot plot analysis of phage vB_EcoS_HSE2 with phage K1ind1 and Jersery. The genes that were absent in phage K1ind1 genome are shown.

